After a week of travelling the two larger Western cities,
there were a few recurring questions on the minds of both investors and advisors. When will this price correction be over, and are we headed towards a recession? After sharing our thoughts on those questions so many times over the past week, here are answers from those meetings, with some charts to help illuminate.
When Will The Correction End?
Perhaps this question is in part jest, as nobody really can tell, but we can put things into context. We continue to label this a corrective phase. Asset prices were goosed higher over the past few years from changing consumer behaviour to more goods purchases (better for index earnings). With less to do, individuals saved more, which landed in the markets. Central banks kept rates low and injected liquidity and fiscal spending to boost economic growth. Now many of those ‘goosers’ are reversing, and the somewhat inflated market is deflating (or de-goosing, if you prefer). All asset prices were lifted simultaneously higher for many years; just look what a plain vanilla balanced allocation did over the past three years. And now all prices are moving lower in stocks, bonds, and real estate [ check out a refresher of last week’s edition ].
Is there an event or some piece of news that would end the market weakness and flip on an extended rebound? Perhaps a ceasefire, a lower inflation print, or the central banks saying something more market-friendly. Often at market turning points, a common narrative develops afterwards that points to some event(s) that caused the change in direction. We think this becomes popular as most feel reassured if there was a cause and event connection in the market. But these are really just coincidental.
The markets are an aggregation of investor behaviour. The selling pressure will end when a tipping point occurs among sellers finishing selling, potential sellers deciding current prices are no longer worth selling, and buyers come in attracted by lower prices. This may occur on the day of some macro news, but really it just happens.
Two positives that this ‘day’ may be nye are sentiment and valuations.
Sentiment –
U.S. AAII Investor Survey continues to flag a near-term lopsided bearish tilt. The Bulls minus the Bears are down to -24. Interestingly, the outright bearish sentiment has decreased from a high of 59.4 at the end of April down to 49.0. A sentiment indicator such as this one can be rather jumpy, which is why it’s beneficial to use a moving average to help smooth it out. The 4-week moving average of the Bulls minus the Bears is now down to -
29.7, well below what historically is considered a good contrarian signal. Looking back to 1987, anytime this spread has been below minus 20, the average forward-looking returns over the next few months are very promising, as seen in the chart below. In addition to this survey data, the CNN Fear & Greed Index, a composite of seven fear and greed technical indicators, stands at 6, near the very bottom of the ‘extreme fear’ zone.
Value to Volatility – Valuations give us insight into prospective returns. Lower valuations typically align with higher expected returns. When combined with elevated levels of market volatility, this creates relative attractiveness for investments. The VIX index, often known as the ‘fear gauge,’ measures implied market volatility based on a set of S&P 500 index options. It’s currently above 30, which is historically high, and market valuations have come down substantially. When traders expect the market to be very volatile combined with the relative “cheapness” of the market, it tells us if market fundamentals
and investor sentiment are in sync. At current levels, there appears to be a bit of a disconnect. The ratio of S&P 500 forward price earnings to the VIX currently stands at 0.54, well below its historical average of around 1. This happens when valuations are low, and the VIX is high. A clear sign that market
panic has set in, and valuations have reached a level relative to volatility that can be seen as supportive. Based on average forward six-month returns, it’s an
opportunistic time to buy, but emotionally one of the hardest.
The Recession Question
A drop in equity prices that is not accompanied by a near-term recession is always a buying opportunity. A drop in equity prices that is a precursor or warning signal for a recession is not a buying opportunity. So, is there a recession coming soon? We do not believe so. Note the stock market has predicted nine of the last four recessions.
Yes, there have been several recession canaries over the past few months. We have seen a part of the yield curve, 2s vs 10s, invert for a moment. Not our preferred part of the curve to watch but still noteworthy. Oil prices spiking to this degree has foreshadowed economic weakness. Consumer sentiment has been weak, another warning sign. We don’t discount these signs, but there is the other side of the ledger. Supply chain issues have created backlogs in manufacturing, meaning even if demand slowed a bit, the activity would remain for some time to catch up. The U.S. consumer is in fabulous shape with employment gains, wage gains, and lots of pent-up savings. Not sure why they are so cranky in the survey data; maybe inflation, maybe
the war, or maybe the surveys are just off these days. This unhappy consumer continues to spend like a happy consumer.
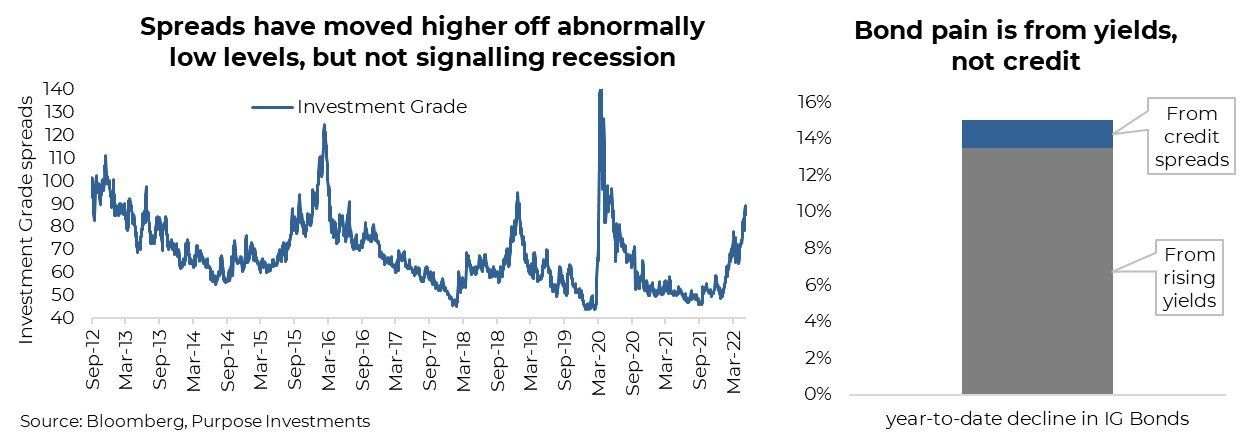
And then there are credit spreads – this is key. Investment-grade bonds (IG), measured by one of the biggest U.S. ETFs, are down about 15% so far this year. However, investment-grade credit spreads have only risen from about 50bps to 80bps. Not exact math here, the IG ETF has a duration of 9 and the credit spreads are based on 5-years, but only about 1/10th of the year-to-date declines are attributed to credit. So the vast majority is from a repricing of yield.
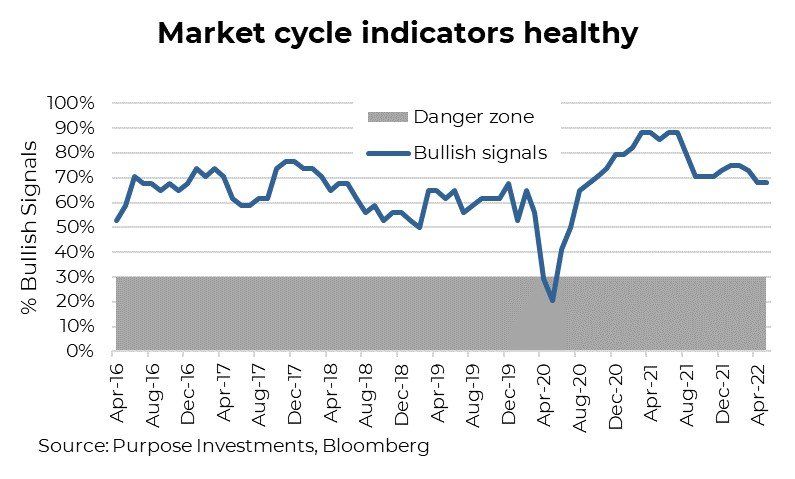
There is a recession out there, and as this year progresses, the economic data will likely cool. This will make the recession chatter increase, but it is way too early to start drawing conclusions or positioning in our view. Always good to be early, but if you're over a year or two early, well, that is just wrong. The majority of our market cycle indicators remain positive. While there has been some deterioration over the past year, we remain well above the danger zone. Global indicators have softened, but the U.S. – the largest economy – remains strong. And fundamentals, which incorporate valuations and earnings growth, remain encouraging.
Investment Implications
This market does have many similarities with the 1994 period of market weakness. Bonds and equities fell together as the market wrestled with fast rate hikes simultaneous with slowing fiscal spending as governments addressed deficits. While there are differences, the market reaction in bonds and equities is similar. It’s worth noting that while equally painful for portfolios, it did set the stage for a strong rebound in subsequent months and quarters.
We don’t know if the sellers are getting tired or less motivated given lower prices or if value investors are starting to step in more aggressively yet. Truthfully, we will only know after the fact. But it does appear things are starting to line up; valuations are attractive, sentiment is flashing ‘buy,’ and perhaps the price correction has nearly run its course. If you agree that recession risk is low, this is likely a buying opportunity.
Source: Charts are sourced to Bloomberg L.P. and Purpose Investments Inc.
The contents of this publication were researched, written and produced by Purpose Investments Inc. and are used by Echelon Wealth Partners Inc. for information purposes only.
This report is authored by Craig Basinger, Chief Market Strategist, Purpose Investments Inc.
The contents of this publication were researched, written and produced by Purpose Investments Inc. and are used herein under a non-exclusive license by Echelon Wealth Partners Inc. (“Echelon”) for information purposes only. The statements and statistics contained herein are based on material believed to be reliable but there is no guarantee they are accurate or complete. Particular investments or trading strategies should be evaluated relative to each individual's objectives in consultation with their Echelon representative.
Echelon Wealth Partners Ltd.
The opinions expressed in this report are the opinions of the author and readers should not assume they reflect the opinions or recommendations of Echelon Wealth Partners Ltd. or its affiliates. Assumptions, opinions and estimates constitute the author's judgment as of the date of this material and are subject to change without notice. We do not warrant the completeness or accuracy of this material, and it should not be relied upon as such. Before acting on any recommendation, you should consider whether it is suitable for your particular circumstances and, if necessary, seek professional advice. Past performance is not indicative of future results. The comments contained herein are general in nature and are not intended to be, nor should be construed to be, legal or tax advice to any particular individual. Accordingly, individuals should consult their own legal or tax advisors for advice with respect to the tax consequences to them.
Purpose Investments Inc.
Purpose Investments Inc. is a registered securities entity. Commissions, trailing commissions, management fees and expenses all may be associated with investment funds. Please read the prospectus before investing. If the securities are purchased or sold on a stock exchange, you may pay more or receive less than the current net asset value. Investment funds are not guaranteed, their values change frequently and past performance may not be repeated.
Forward Looking Statements
Forward-looking statements are based on current expectations, estimates, forecasts and projections based on beliefs and assumptions made by author. These statements involve risks and uncertainties and are not guarantees of future performance or results and no assurance can be given that these estimates and expectations will prove to have been correct, and actual outcomes and results may differ materially from what is expressed, implied or projected in such forward-looking statements. Assumptions, opinions and estimates constitute the author’s judgment as of the date of this material and are subject to change without notice. Neither Purpose Investments nor Echelon Partners warrant the completeness or accuracy of this material, and it should not be relied upon as such. Before acting on any recommendation, you should consider whether it is suitable for your particular circumstances and, if necessary, seek professional advice. Past performance is not indicative of future results. These estimates and expectations involve risks and uncertainties and are not guarantees of future performance or results and no assurance can be given that these estimates and expectations will prove to have been correct, and actual outcomes and results may differ materially from what is expressed, implied or projected in such forward-looking statements. Unless required by applicable law, it is not undertaken, and specifically disclaimed, that there is any intention or obligation to update or revise the forward-looking statements, whether as a result of new information, future events or otherwise.
Before acting on any recommendation, you should consider whether it is suitable for your particular circumstances and, if necessary, seek professional advice.
The particulars contained herein were obtained from sources which we believe are reliable, but are not guaranteed by us and may be incomplete. This is not an official publication or research report of either Echelon Partners or Purpose Investments, and this is not to be used as a solicitation in any jurisdiction.
This document is not for public distribution, is for informational purposes only, and is not being delivered to you in the context of an offering of any securities, nor is it a recommendation or solicitation to buy, hold or sell any security.