Spending all my years on this planet and not traveling at extreme speeds, time has always seemed pretty linear and constant. Just check your watch. However, you can also think of time as how your brain codifies and references the flow of events. This can lead to the common phrase ‘time flew by’. But during periods of emotional discomfort, it often feels like time slows or drags by.
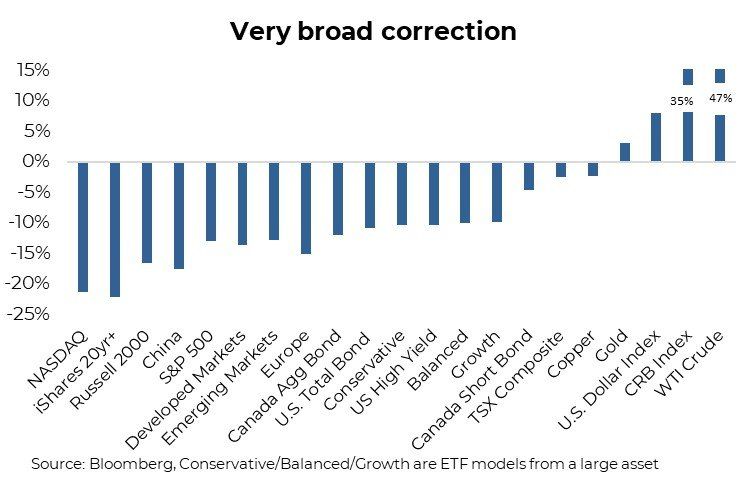
We are deep in a correction that encapsulates multiple asset classes. And it is not just weakness, the daily gyrations are truly breathtaking. Over the past 10 trading sessions, the U.S. S&P 500 has seen 5 sessions with daily returns +/- 2%. For anyone who invests, this is creating a great deal of uncertainty. Is my portfolio correctly positioned? Should I do something? And to top it all off, time sure seems like it has slowed down.
During periods of heightened volatility (aka markets dropping) the risk of making an emotionally induced behavioural mistake is the greatest. Which often
translates into making a portfolio mistake. Emotions are nice to have but tend to get in the way when investing. To help control our emotions, we will turn to
facts and a longer term perspective. It may not make time speed back up but it could help reduce the risk of making a mistake.
This is a dramatic price correction across most asset classes – We can attribute this drop in prices of assets to any number of factors. Inflation got a bit out of control, central bankers are pivoting from doves to hawks very quickly, valuations got too far stretched, the economy is starting to slow, yields, both nominal and real, are rising. Then there is the war, the pandemic appears to still be an issue and commodity prices have spiked higher. It is possible we missed a few.
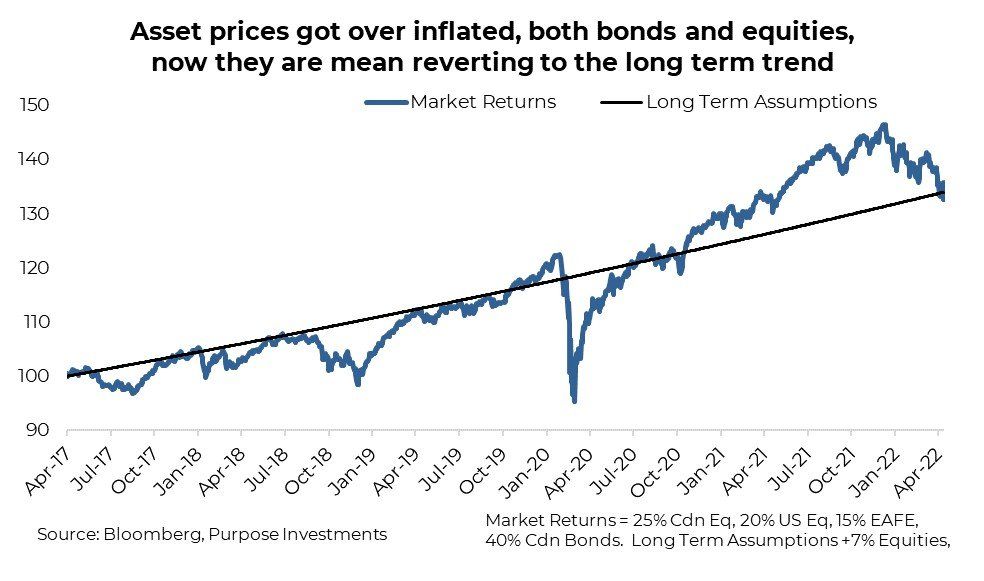
Let us not forget that markets, both equity and bonds, enjoyed returns well above historical norms over the previous few calendar years. [this is a brief repeat from last week, but worth reiterating] If you assume long term equity returns are 7% and bond returns 4%, that means a plain vanilla 60/40 portfolio (60% equity, 40% bonds) should deliver about 5.8% annually. Some years will be higher, some lower. However, the last few years have been higher, materially so. Annual returns for a plain vanilla balanced strategy have been +16%, +9% (including a bear market drop) and +12% in 2019, 2020 and 2021. Those are juicy returns or at least above norms. And while bonds fell 3% in 2021, 2019 was +7% and 2020 was +9%, both above norms.
We are not saying bonds or equities can’t go lower from here. Instead, we are suggesting to put the recent weakness in prices into a longer term perspective. We all enjoyed outsized returns over the past few years due to a number of factors. Consumer behaviour pivoted to more goods spending over services, that is better for equity market earnings. Stimulus was unprecedented and left on too long, to help mitigate the impact of the pandemic which weigh disproportionately on some cohorts of the economy while benefiting others. All together, this goosed asset prices from equities, to bonds, to real estate.
Now that spending is pivoting back to normal (normal balance of goods vs services spending) and central banks are removing stimulus, the goose is deflating. Stock and bond prices have reacted quickly, given quick to adjust pricing. Real estate may be a longer adjustment process, a drawdown to less transparent pricing.
Turning to valuations, it is safe to say much of the froth is now long gone. In fact, valuations in equities have come down substantially. In late 2021, the Nasdaq was trading 35x earnings, it is now 24x. The S&P 500 has dropped from 23x to 18x and the TSX from 20x to well below historical norms at 13x. Now valuations do not mark tops or bottoms in markets, but they do influence forward return expectations. And if there isn’t a full blown recession looming, the return outlook has improved.
Bond valuations (yields) are also becoming more enticing. That is what happens when the price of bonds drops, the forward yields rise. Given the pain in bond land, yields are up substantially. The Bloomberg Canada Aggregate carries a yield to worst of 3.5%, the U.S. Investment Grade index has a yield of 4.4%. Don’t forget in that earlier chart comparing returns to a longer trendline, that trendline used a 4% return for bonds as the assumption. We are kind of there.
Given the price gyrations, there is no doubt emotions are elevated. Staying the course, not overreacting, is often the best path through these kind of markets. Or for those with the stomach, there are things on sale out there. It may hurt a little bit to trade, but investing is often like going to the gym - if it doesn’t feel a bit awkward or a degree of discomfort, you just are not doing it right.
Source: Charts are sourced to Bloomberg L.P. and Purpose Investments Inc.
The contents of this publication were researched, written and produced by Purpose Investments Inc. and are used by Echelon Wealth Partners Inc. for information purposes only.
This report is authored by Craig Basinger, Chief Market Strategist, Purpose Investments Inc.
The contents of this publication were researched, written and produced by Purpose Investments Inc. and are used herein under a non-exclusive license by Echelon Wealth Partners Inc. (“Echelon”) for information purposes only. The statements and statistics contained herein are based on material believed to be reliable but there is no guarantee they are accurate or complete. Particular investments or trading strategies should be evaluated relative to each individual's objectives in consultation with their Echelon representative.
Echelon Wealth Partners Ltd.
The opinions expressed in this report are the opinions of the author and readers should not assume they reflect the opinions or recommendations of Echelon Wealth Partners Ltd. or its affiliates. Assumptions, opinions and estimates constitute the author's judgment as of the date of this material and are subject to change without notice. We do not warrant the completeness or accuracy of this material, and it should not be relied upon as such. Before acting on any recommendation, you should consider whether it is suitable for your particular circumstances and, if necessary, seek professional advice. Past performance is not indicative of future results. The comments contained herein are general in nature and are not intended to be, nor should be construed to be, legal or tax advice to any particular individual. Accordingly, individuals should consult their own legal or tax advisors for advice with respect to the tax consequences to them.
Purpose Investments Inc.
Purpose Investments Inc. is a registered securities entity. Commissions, trailing commissions, management fees and expenses all may be associated with investment funds. Please read the prospectus before investing. If the securities are purchased or sold on a stock exchange, you may pay more or receive less than the current net asset value. Investment funds are not guaranteed, their values change frequently and past performance may not be repeated.
Forward Looking Statements
Forward-looking statements are based on current expectations, estimates, forecasts and projections based on beliefs and assumptions made by author. These statements involve risks and uncertainties and are not guarantees of future performance or results and no assurance can be given that these estimates and expectations will prove to have been correct, and actual outcomes and results may differ materially from what is expressed, implied or projected in such forward-looking statements. Assumptions, opinions and estimates constitute the author’s judgment as of the date of this material and are subject to change without notice. Neither Purpose Investments nor Echelon Partners warrant the completeness or accuracy of this material, and it should not be relied upon as such. Before acting on any recommendation, you should consider whether it is suitable for your particular circumstances and, if necessary, seek professional advice. Past performance is not indicative of future results. These estimates and expectations involve risks and uncertainties and are not guarantees of future performance or results and no assurance can be given that these estimates and expectations will prove to have been correct, and actual outcomes and results may differ materially from what is expressed, implied or projected in such forward-looking statements. Unless required by applicable law, it is not undertaken, and specifically disclaimed, that there is any intention or obligation to update or revise the forward-looking statements, whether as a result of new information, future events or otherwise.
Before acting on any recommendation, you should consider whether it is suitable for your particular circumstances and, if necessary, seek professional advice.
The particulars contained herein were obtained from sources which we believe are reliable, but are not guaranteed by us and may be incomplete. This is not an official publication or research report of either Echelon Partners or Purpose Investments, and this is not to be used as a solicitation in any jurisdiction.
This document is not for public distribution, is for informational purposes only, and is not being delivered to you in the context of an offering of any securities, nor is it a recommendation or solicitation to buy, hold or sell any security.