Following numerous conversations with both investors and advisors, a common theme has emerged, which we will paraphrase as follows: “We own bonds for some income but mainly to provide a stabilizer for the portfolio during periods of equity market weakness. So far this year, the equity market is in correction mode and bonds are not helping—they’re hurting. Should we throw out our bonds and reconstruct our portfolios?”
Let’s just take a breath. As managers of tactical balance strategies that use bonds, we share the frustration. And hopefully your bond allocations are shorter duration or have more credit or have some alternative strategies that have held up better—but let’s not forget what bonds and equities did over the past couple years.
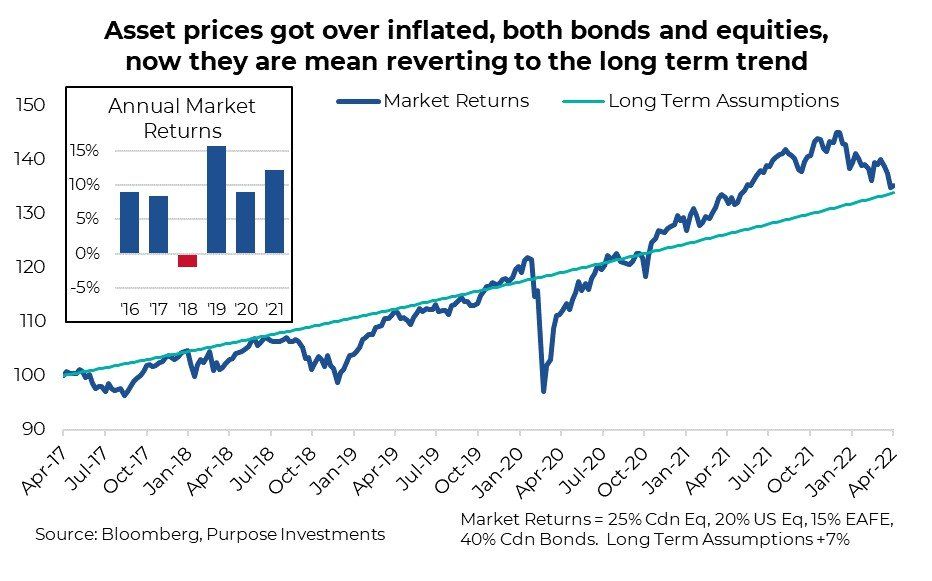
Let us assume long-term equity returns are 7% and bond returns are 4%. You can have higher assumptions if you like, but the takeaway from this exercise is the same. That means a plain vanilla 60/40 portfolio (60% equity/40% bonds) should deliver about 5.8% annually. Some years will be higher, some lower. However, the last few years have been higher, materially so.
Annual returns for a plain vanilla balanced strategy have been +16%, +9% (including a bear market drop), and +12% in 2019, 2020, and 2021. Those are juicy returns—or at least above norms. And while bonds fell 3% in 2021, 2019 was +7% and 2020 was +9%, both above norms.
We are not saying bonds or equities can’t go lower from here. Instead, we are suggesting putting the recent weakness in prices into a longer-term perspective. We all enjoyed outsized returns over the past few years because of several factors. Consumer behaviour pivoted to more goods spending over services, which is better for equity market earnings. Stimulus was unprecedented and left on too long to help mitigate the impact of the pandemic, which weigh disproportionately on some cohorts of the economy while benefitting others. Altogether, this goosed asset prices from equities, to bonds, to real estate.
Now that spending is pivoting back to normal (normal balance of goods vs services spending) and central banks are removing stimulus, the goose is deflating. Stock and bond prices have reacted quickly, given quick to adjust pricing. Real estate may be a longer adjustment process, a drawdown to less transparent pricing.
Making sure your bond allocations have a diversified approach including some plain vanilla some active credit and some alternative strategies continues to be the best path forward.
As is the case with equity allocations, thoughtful, well-constructed portfolios remains the way to go, during above-average years with double-digit returns and in years with below average negative returns.
Active vs passive management
The debate between active and passive portfolio management is not new; and there are strong arguments on both sides. Fans of passive index following strategies often argue passive has a fee advantage and clear strong performance. Proponents of active management often cite the mutual social good of price discovery, that certain markets are less efficient, and the importance of risk management controls around concentration.
The debate is often framed in a binary fashion— either active or passive. Yet from a portfolio-construction perspective, investments, whether active or passive, are building blocks for building a portfolio. How the pieces are selected, and fit together, given exposures to different factors at different costs in different markets, is much more important than an academic debate. After all, at the portfolio-construction level, all investment decisions are active, even if you opt to use market capitalization weighted passive vehicles or more active strategies designed to gain or reduce exposure to certain factors.
In this investor strategy, we will dive into the active vs passive discussion and provide considerations for each given the market and environment.
Spoiler alert from the title: our approach to portfolio construction incorporates both active and passive strategies, sometimes even in the same markets.
Shades of grey
Terms can be misleading, so before we get into the weeds of the active vs. passive debate, we should clarify a few things.
Passive investing has changed a lot since Jack Bogle championed the case for index investing years ago. Index investing is simply a way to gain exposure to an index. Historically, most indices were aggregates of a certain market and weighted based on market cap. These types of funds are some of the largest in Canada and the United States. They feature massive liquidity and usually small fees. Active investing is any deviation from a set benchmark with the aim of a different performance experience. This can be in search of higher returns, less volatility, or even uncorrelated returns.
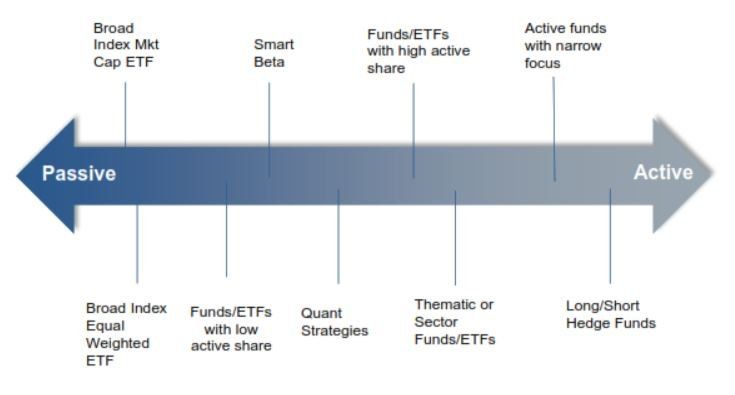
Given there is no shortage of available strategies, it is better to think of active to passive as a spectrum. A fund or ETF can sit anywhere along this spectrum depending on the strategy being implemented. And it’s worth noting that structure does not imply the strategy any longer. There are funds that are passive and ETFs that are active. Life used to be simpler in the olden days.
The far left
The far left of our active/passive spectrum is where you would find pure beta, low-fee index exposure ETFs and funds. The goal is simply to match market returns for a low fee.
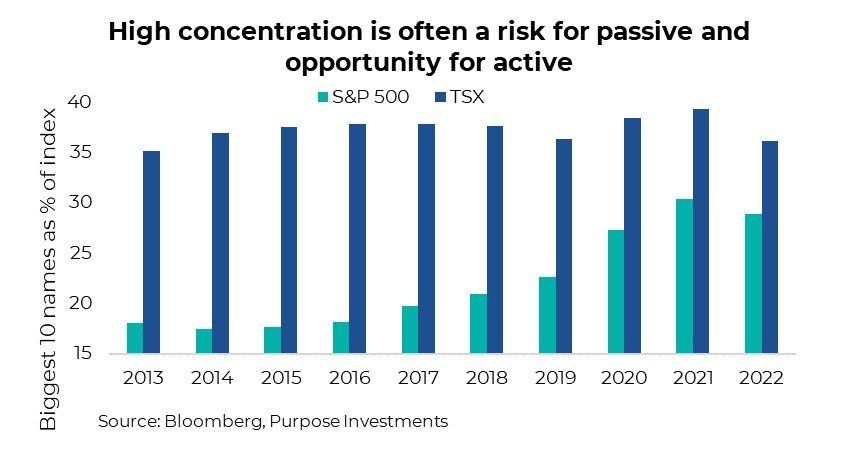
For these, it is crucial to know and understand the underlying index. Are there concentration issues? The NASDAQ QQQ ETF has a 12% weight in Apple and 10% in Microsoft. There’s nothing wrong with that, as long as you’re aware of it when combining it with the rest of your portfolio. Even the broad-based S&P 500 Index can become very top heavy (see the chart below). The S&P/TSX Composite is mostly financials, energy, and materials. The S&P 500 has seen mega cap names become increasingly weighted in the index. Concentration is a risk that is worth considering. It can be an opportunity for active strategies as well, if those mega caps begin to underperform.
There is also market efficiency.
For a passive strategy, consider if it is easy to trade or if there market inefficiencies. Fixed-income indices are often difficult to fully replicate and inherently provide higher weighting to the most indebted companies. Perhaps that is not the most ideal weighting scheme. Real estate and other private markets are also not well served by passive investments.
The far right
Often the most active strategies are simply trying to produce a materially different performance experience. Some are focused on outperformance of their respective asset class. Others are attempting to lower volatility or provide uncorrelated performance for diversification benefits.
Manager selection and strategy is paramount here. Costs tend to be higher so make sure it is truly a differentiating strategy. Active share can be a useful way to determine how closely a fund mimics its underlying benchmark. Research suggests that the deck is stacked against active managers when it comes to long-term performance. However active management can still outperform – given the right combination of talent and discipline…a little luck never hurts either.
It’s important to pick your markets.
Active managers typically have a better edge in markets that are less efficient, or poorly designed in the first place. It’s very difficult to have an edge in large cap U.S. equites but
emerging markets, preferred shares, and other smaller, less liquid markets is where active managers have a real edge. Due diligence for any investment is important, but even more so for actively managed funds. There is a big divide between the best and worst, whereas there are only small differences when it comes selecting between passive ETFs.
Everything in between
It’s the middle of the spectrum is where the lines begin to blur. It’s where we’d place your smart beta, factor, and quant funds.
Their primary aim is to provide alpha at lower prices by being systematic in nature to isolate certain exposures. Whether its equal weighted ETFs or single factor-based ETFs to gain exposure to dividends, value, momentum, etc., these investments typically are quant-based and don’t have a team of analysts doing bottom-up analysis.
The actual management maybe be mechanically passive, but it is certainly an active call, leaving it up to individual investors to decide which risk factors to get exposure to. In essence, these tools now make it easier than ever to unbundle a portfolio and allow investors to actively select which risk factors will be purchased. Systematic strategies can help enhance portfolios by providing a cost-effective option to gain specific exposures, but even if they use passive ETFs, these types of investments begin to lean more active.
Similarly, actively managed mutual funds that have a low active share and low turnover probably lie somewhere in the middle of the spectrum.
You might be paying active management fees, but the returns will largely resemble benchmark returns less the fees. As new products continue to evolve, the lines between passive and active will continue to blur. Terms such as enhanced index construction or adding ESG considerations to market indexes are both examples of how product manufacturers can create something new, with a bit of a tilt.
The great debate
The narrative we are attempting to change is that perhaps the individual investment active vs. passive debate is not as important as it is made out to be. Okay, perhaps it is important, but on the scale of most important to least important, it is tilted towards the latter.
Just look at the below table. A negative percentage states that passive outperformed active, while a positive percentage states active outperformed passive. For the most part, looking at these four long-term categories, passive outperformed, but not by very much. Driving home the point that the active v. passive debate has some importance, but perhaps not as much as it is given.
Higher on the scale of importance in portfolio construction is how the pieces of the portfolio complement each other. To achieve the goals set out for the portfolio, the components must work with each other and against each other to manifest strong portfolio diversification. Actively managing each piece
of your own portfolio is what is going to achieve success, not whether you chose an active equity mutual fund or a passive equity index ETF.
The management decision should come down to whether we should be adding to a certain sector, country, or factor determined by the current portfolio exposures and tilts. While the most favorable result may come from combining a little bit of passive here and a little bit of active there, the overarching concern should always be the asset allocation of the portfolio.
Every portfolio-construction decision is active
Breaking away from the active vs. passive debate is easy when thinking of asset allocation decisions from a portfolio perspective. In constructing and managing portfolios, you make active decisions, regardless of the solutions or products you chose to include. Whether you are adding U.S. exposure or tilting a portfolio more into growth, those are decisions you must actively make. Even if you use a passive investment, you still actively made that decision at the portfolio level.
Below is a checklist of sorts or specific areas to consider during the investment vehicle selection process for potential inclusion in a portfolio from the lens of active vs passive. This is not an exhaustive list:
It is really not about active or passive. Ask yourself: what does an investment bring to the existing portfolio? Does it provide added exposure to a factor that you believe will benefit the portfolio given the macro market environment and outlook?
Whether to go active or passive, is actually a ways down the decision-making process. We have found complementing low-cost passive with active provides a much more diverse and resilient exposure in various asset classes from bonds to equities. There is no winner, they are simply building blocks for a portfolio.
Source: Charts are sourced to Bloomberg L.P. and Purpose Investments Inc.
The contents of this publication were researched, written and produced by Purpose Investments Inc. and are used by Echelon Wealth Partners Inc. for
information purposes only.
This report is authored by Craig Basinger, Greg Taylor and Derek Benedet Purpose Investments Inc.
The contents of this publication were researched, written and produced by Purpose Investments Inc. and are used herein under a non-exclusive license by Echelon Wealth Partners Inc. (“Echelon”) for information purposes only. The statements and statistics contained herein are based on material believed to be reliable but there is no guarantee they are accurate or complete. Particular investments or trading strategies should be evaluated relative to each individual's objectives in consultation with their Echelon representative.
Echelon Wealth Partners Ltd.
The opinions expressed in this report are the opinions of the author and readers should not assume they reflect the opinions or recommendations of Echelon Wealth Partners Ltd. or its affiliates. Assumptions, opinions and estimates constitute the author's judgment as of the date of this material and are subject to change without notice. We do not warrant the completeness or accuracy of this material, and it should not be relied upon as such. Before acting on any recommendation, you should consider whether it is suitable for your particular circumstances and, if necessary, seek professional advice. Past performance is not indicative of future results. The comments contained herein are general in nature and are not intended to be, nor should be construed to be, legal or tax advice to any particular individual. Accordingly, individuals should consult their own legal or tax advisors for advice with respect to the tax consequences to them.
Purpose Investments Inc.
Purpose Investments Inc. is a registered securities entity. Commissions, trailing commissions, management fees and expenses all may be associated with investment funds. Please read the prospectus before investing. If the securities are purchased or sold on a stock exchange, you may pay more or receive less than the current net asset value. Investment funds are not guaranteed, their values change frequently and past performance may not be repeated.
Forward Looking Statements
Forward-looking statements are based on current expectations, estimates, forecasts and projections based on beliefs and assumptions made by author. These statements involve risks and uncertainties and are not guarantees of future performance or results and no assurance can be given that these estimates and expectations will prove to have been correct, and actual outcomes and results may differ materially from what is expressed, implied or projected in such forward-looking statements. Assumptions, opinions and estimates constitute the author’s judgment as of the date of this material and are subject to change without notice. Neither Purpose Investments nor Echelon Partners warrant the completeness or accuracy of this material, and it should not be relied upon as such. Before acting on any recommendation, you should consider whether it is suitable for your particular circumstances and, if necessary, seek professional advice. Past performance is not indicative of future results. These estimates and expectations involve risks and uncertainties and are not guarantees of future performance or results and no assurance can be given that these estimates and expectations will prove to have been correct, and actual outcomes and results may differ materially from what is expressed, implied or projected in such forward-looking statements. Unless required by applicable law, it is not undertaken, and specifically disclaimed, that there is any intention or obligation to update or revise the forward-looking statements, whether as a result of new information, future events or otherwise.
Before acting on any recommendation, you should consider whether it is suitable for your particular circumstances and, if necessary, seek professional advice.
The particulars contained herein were obtained from sources which we believe are reliable, but are not guaranteed by us and may be incomplete. This is not an official publication or research report of either Echelon Partners or Purpose Investments, and this is not to be used as a solicitation in any jurisdiction.
This document is not for public distribution, is for informational purposes only, and is not being delivered to you in the context of an offering of any securities, nor is it a recommendation or solicitation to buy, hold or sell any security.