Markets have been absorbing a lot of bad news so far in 2022.
The Fed went from the market’s bestie to that ex-friend who likes to run away with your punch bowl. Inflation, now charged by Covid and conflict disruptions, has remained persistently high. Commodity prices are rising, and in many cases reaching or besting peak levels from the 2002-2008 commodity super cycle. Bond yields have risen at the fastest pace since the mid 1990s, including real yields rising back near positive levels. There are disruptive gyrations in currency markets, from USD appreciation to euro and yen declines. And add to this, the war.
For weeks the market had been absorbing all this negative news. Yes, it had been clearly weighing on prices, but it seemed almost orderly. Most of the pain was focused on high-valued tech, while defensive equities such as utilities, health care and staples were making new highs. Well,
at some point last Wednesday or Thursday, that half full glass suddenly become half empty, and markets tumbled as one.
The popular narratives for this sudden drop include rising Covid cases in China or earnings falling short. Covid cases have been rising in China for some time as have shutdowns, and earnings have not fallen short in aggregate. As always, some have done better and some worse, but the reaction to earnings fades quickly as the macro trend dominates prices—just ask Tesla, which by all metrics took a huge beat on the quarter, with earnings +42% vs expected, and the shares were down 14% a week later.
Someone might be broken -
The speed of the equity declines this past week could mean that something, somewhere is broken. Perhaps some hedge funds or quant strategies caught on the wrong side of the move in yields or perhaps currencies. We don’t have any knowledge of such an event but given the pace of yield increases, very large currency gyrations, and rapid-style rotations, the odds are good.
This isn’t just ‘sell in May’ coming early this year. Maybe we will hear about a hedge fund blow up in a month’s time, which certainly doesn’t help us today.
What Next?
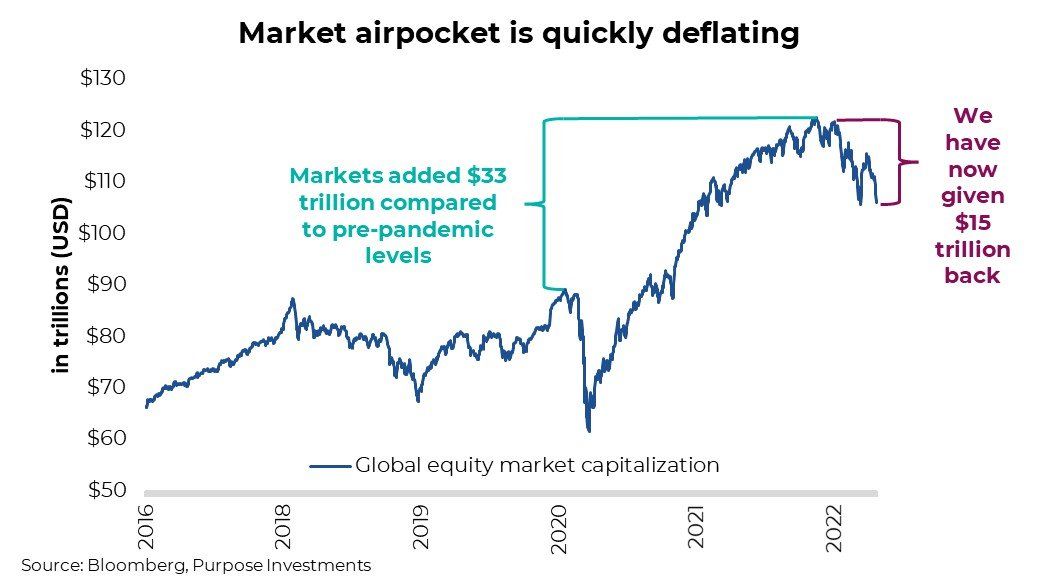
Let’s take a step back. The pandemic changed aggregate behaviours to consume more goods (less services), save more, and invest more. A global consumer tilted towards more goods fueled corporate earnings that are more geared towards that kind of spending. And we are including housing as goods. Meanwhile interest rates remained very low to stimulate or protect pockets of the economy that were struggling. What a perfect environment for asset prices, from homes, stocks to bonds.
Global equity markets appreciated by $33 trillion compared with before the pandemic. The was +38% compared with a world that didn’t have Covid that was fueled by all the above-mentioned factors. Now these positive factors or tailwinds are reversing. Service spending is on the rise, good spending is slowing. Interest rates and yields have risen and look to continue on that path. Economic growth is slowing. Tally it all up, we have given back $15 trillion or about ½.
Investing is easy. When markets drop, if there is a recession coming, run for the hills. When markets drop, and there is not imminent recession, it’s a buying opportunity. Forecasting recessions is hard. So, for those brave or with a high enough risk tolerance to potentially buy into this weakness there are two questions: 1) Is there a recession coming? 2) How deep does the market weakness go?
Recession call – it’s too early
You may have heard the popular idiom, “the stock market has predicted nine of the last five recessions.” So, is this a false alarm or is the wisdom of the crowds encapsulated in stock prices giving an early warning? Even beyond the equity markets, there are a few recession canaries that don’t look very healthy.
Yield curve –
While not our preferred term combination, the brief inversion of 10- and 2-year yields in the U.S. is still noteworthy. Ignoring a yield curve inversion has proven costly over the past decades. Still, we prefer the 10-year and 3-month relative yields, which has not inverted.
Commodity prices –
Spikes of this size in commodities, and most importantly oil, have been early precursors to slowing consumer spending and potential recessions. Most developed economies are less sensitive today than in decades past, but many developing economies are not. And food security is an issue given prices—another ingredient that could increase unrest and slow global growth.
Cranky consumer –
Consumer sentiment, not just in the U.S., has been poor for many quarters. This too is an early warning of recessions. Consumers are still spending though, and perhaps the negative survey sentiment data is being influenced by inflation or Covid. People’s words are not matching their actions, but it’s still worth noting. BUT, there are a lot of positive aspects in the global economy as well. Manufacturing, albeit impacted by lingering pandemic factors, remains very robust. Employment gains continue, including wage gains. Leading indicators still rising. Recession probabilities from the NY Fed and Cleveland Fed remain very low. We believe it is too early to signal the recession alarm bells. Our Market Cycle framework has picked up on some weakness in the data but remains well in the safe zone. However, as growth does slow this year, you can believe the recession talk will gain popularity. We just don’t think it is imminent.
Bottom fishing?
If you agree the recession risk is low, then this correction is a buying opportunity. Naturally, this brings up the question as to the depth and duration. For this, we will first take a quick look at valuations and then our Correction Watch indicators.
Valuations –
Full disclosure, valuations do not signal market tops or bottoms. But they can provide insights as to expected forward returns. There is not denying, the market declines in 2022 coupled with decent earnings growth, valuations have come down considerably. The S&P, NASDAQ and TSX are now trading back to valuation levels seen last in 2019. From recent peak valuations, the TSX has fallen from 20.4x to 12.8x, S&P from 23.2x to 17.7x and the NASDAQ from 34.6 to 23.9x.
Not saying the market is a screaming buy based on valuations, but these lower multiples certainly provide a bit of a safety cushion.
Correction Watch Indicators –
Corrections can go on longer than people expect, and they can also end abruptly. There is not one measure that works, so we take a balanced approach, looking at various sentiment/technical indicators. Most signals do appear to be full on, which often means the bottom may be near.
The CBOE Volatility index (VIX) is elevated and rose into the 30s on Tuesday. This has historically been the top of the VIX for most market pullbacks. It does go much higher in full on bear markets/recessions, but we are going with our above assumption that is not the scenario. Credit spreads—the added yield on corporate bonds above governments—have risen and, similar to the VIX, are near toppy levels for plain-vanilla corrections.
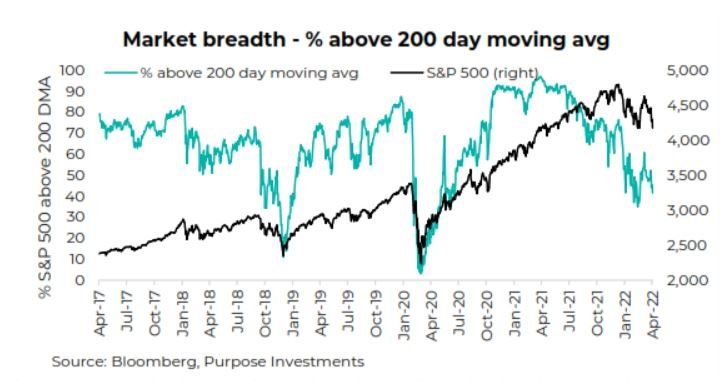
Market breadth has fallen, with over 50% of companies in the S&P 500 trading below their 200-day moving averages. This is still a bit high but is near typical trough levels for corrections, which also brings up the selling over the past few days. It has been broad based, with all stocks moving lower from the cyclical to the defensives. That is often a sign that capitulation is at hand.
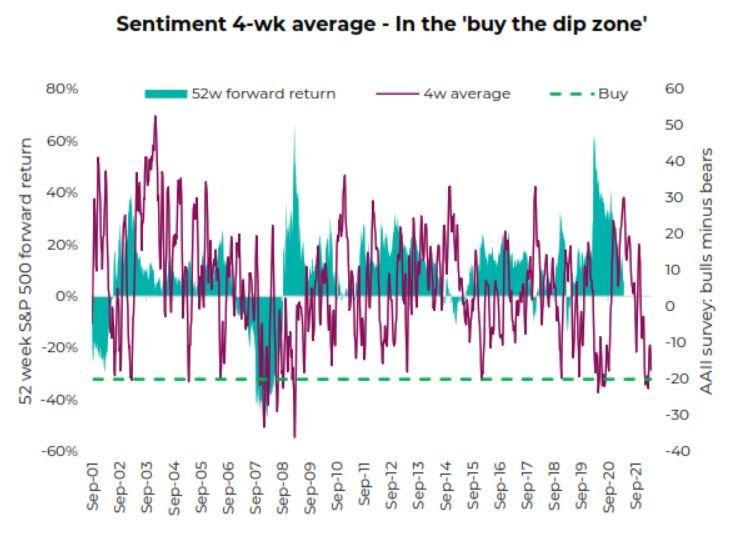
Investor sentiment has been very bearish for a bit now. Clearly this signal has been early this correction but nonetheless, there is a good performance track record of buying the market when investors are this bearish.
Other signals that look interesting include the sudden return of negative correlation between bonds and equities and a spike higher in put-to-call ratio.
Investment Implications
Bottom fishing is more dangerous than ice fishing. News could get worse, maybe there is a recession coming, or earnings are about to roll over. Nonetheless, buying during periods of weakness never feels right and waiting for the ‘all clear’ means you missed it all. The one constant in the markets is they overreact—in both directions. Being a contrarian and attempting to take advantage of that overreaction can be very profitable.
If you have the constitution, or riskier short-term capital, it appears time to do some buying. Most of our correction indicators are on, which means the bottom may be close. For those more-aggressive investors, we would focus on the parts of the market that have suffered the most. That means tech or even the broader U.S. market. Or if you are light on international developed markets (not EM), those markets are down, cheap and with the strong CAD (vs euro / yen), there is an extra margin of safety.
Source: Charts are sourced to Bloomberg L.P. and Purpose Investments Inc.
The contents of this publication were researched, written and produced by Purpose Investments Inc. and are used by Echelon Wealth Partners Inc. for
information purposes only.
This report is authored by Craig Basinger, Chief Market Strategist, Purpose Investments Inc.
The contents of this publication were researched, written and produced by Purpose Investments Inc. and are used herein under a non-exclusive license by Echelon Wealth Partners Inc. (“Echelon”) for information purposes only. The statements and statistics contained herein are based on material believed to be reliable but there is no guarantee they are accurate or complete. Particular investments or trading strategies should be evaluated relative to each individual's objectives in consultation with their Echelon representative.
Echelon Wealth Partners Ltd.
The opinions expressed in this report are the opinions of the author and readers should not assume they reflect the opinions or recommendations of Echelon Wealth Partners Ltd. or its affiliates. Assumptions, opinions and estimates constitute the author's judgment as of the date of this material and are subject to change without notice. We do not warrant the completeness or accuracy of this material, and it should not be relied upon as such. Before acting on any recommendation, you should consider whether it is suitable for your particular circumstances and, if necessary, seek professional advice. Past performance is not indicative of future results. The comments contained herein are general in nature and are not intended to be, nor should be construed to be, legal or tax advice to any particular individual. Accordingly, individuals should consult their own legal or tax advisors for advice with respect to the tax consequences to them.
Purpose Investments Inc.
Purpose Investments Inc. is a registered securities entity. Commissions, trailing commissions, management fees and expenses all may be associated with investment funds. Please read the prospectus before investing. If the securities are purchased or sold on a stock exchange, you may pay more or receive less than the current net asset value. Investment funds are not guaranteed, their values change frequently and past performance may not be repeated.
Forward Looking Statements
Forward-looking statements are based on current expectations, estimates, forecasts and projections based on beliefs and assumptions made by author. These statements involve risks and uncertainties and are not guarantees of future performance or results and no assurance can be given that these estimates and expectations will prove to have been correct, and actual outcomes and results may differ materially from what is expressed, implied or projected in such forward-looking statements. Assumptions, opinions and estimates constitute the author’s judgment as of the date of this material and are subject to change without notice. Neither Purpose Investments nor Echelon Partners warrant the completeness or accuracy of this material, and it should not be relied upon as such. Before acting on any recommendation, you should consider whether it is suitable for your particular circumstances and, if necessary, seek professional advice. Past performance is not indicative of future results. These estimates and expectations involve risks and uncertainties and are not guarantees of future performance or results and no assurance can be given that these estimates and expectations will prove to have been correct, and actual outcomes and results may differ materially from what is expressed, implied or projected in such forward-looking statements. Unless required by applicable law, it is not undertaken, and specifically disclaimed, that there is any intention or obligation to update or revise the forward-looking statements, whether as a result of new information, future events or otherwise.
Before acting on any recommendation, you should consider whether it is suitable for your particular circumstances and, if necessary, seek professional advice.
The particulars contained herein were obtained from sources which we believe are reliable, but are not guaranteed by us and may be incomplete. This is not an official publication or research report of either Echelon Partners or Purpose Investments, and this is not to be used as a solicitation in any jurisdiction.
This document is not for public distribution, is for informational purposes only, and is not being delivered to you in the context of an offering of any securities, nor is it a recommendation or solicitation to buy, hold or sell any security.