Over the past number of years there has been a deluge of new data sources. Investors no longer have to wait for company earnings or government statistics to get a sense as to what the economy is doing. This higher frequency data can help in providing an informational edge and generating portfolio insights. Whether or not that edge is still there when it’s become available to your average Joe with a Bloomberg, is another story. Regardless, we do find it useful to help track economic activity, identify trends and pattern and gauge market dislocations. To begin, we’ll look at some of the more interesting and relevant data points to reveal just how far along the path to normal we are and try to better understand how the reopening process is playing out.
It shouldn’t be a surprise that alternative data continues to maintain its upward course in America; but has taken a U-turn in Canada. Renewed lockdowns in many provinces is making it difficult to build any real growth momentum, while much of the U.S.-centric data is reaching its highest level since the onset of COVID-19 last year. We should also remind readers that we’ve officially entered the silly season for any chart that plots YoY data. Many of these alternative data sources already adjusted for this in various ways using two-year stacks or keeping 2019 as the base year.
Measuring the reopening of America
Food delivery trends continue to accelerate, and grocery spending remains elevated thanks to many people continuing to work from home. Credit card data can reveal interesting trends with a tremendous amount of granularity. This data from SpendTrend is as of February (so not exactly high frequency) and provides some useful insights (Chart 1). The U.S. Travel sector is still suffering with February spending still well below normal but the rate of change has picked up.
The largest gain was in Stores/Supermarkets, which are still up 9.4%. Overall, the trends in place show an interesting pattern. The hardest hit sectors are beginning to improve faster and we’re already seeing a softening from the demand spikes last summer for things like building supplies, furniture, and sporting goods. The consumer is healthy but the tastes are changing.
How do we judge what back to normal is? For many, normal is getting together with a few friends for a nice dinner out. The restaurant industry is one of the most heavily impacted consumer segment. OpenTable seated diners saw a large jump the past few weeks with a sharp improvement from the 50% decline in early February and the roughly 30% decline through mid-March. Again, the stark contrast between Canada and the United States with both lines moving in completely opposite directions (Chart 2).
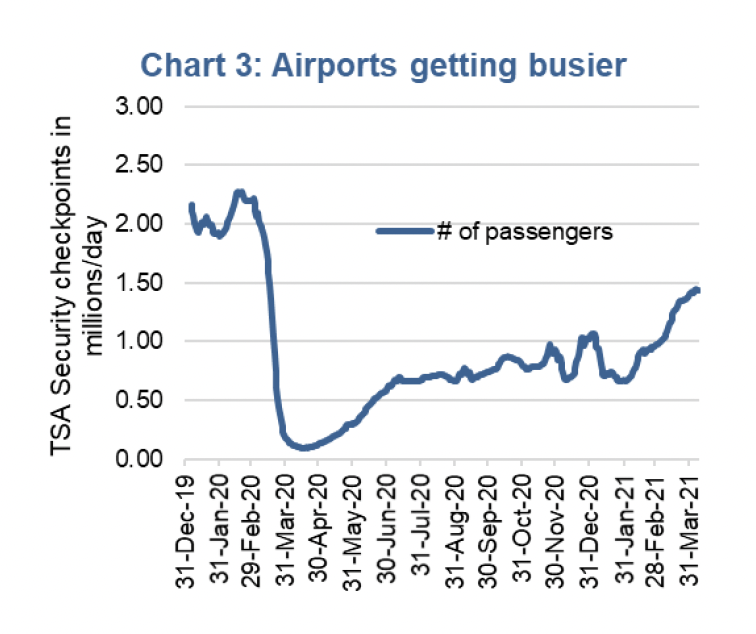
The travel bug is alive and well. Though hard to gauge in real time, U.S. app downloads for VRBO and Expedia, Booking.com and TripAdvisor have all been picking up the past month according to Sensor Tower and are actually higher than they were ago two years ago. TSA Checkpoint activity is also picking up steam (Chart 3).
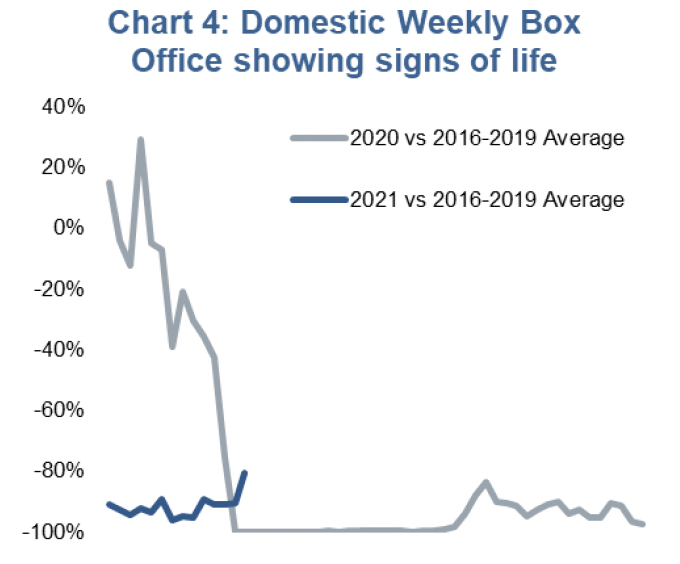
The movie going experience may never be the same. The box-office remains deeply troubled though has had some good news. Last weekend saw a record with Godzilla vs. King Kong taking the crown of largest box office draw post COVID-19. Overall, box office totals are still 70% lower than the average level from 2016-2019 (Chart 4). With Disney+ and other streaming services beginning to release concurrently on their streaming platforms this is one industry that may never truly return to normal.
The virus and vaccines
We remain far away from pre-COVID-19 life in many ways. The work-from-home dynamic may prove stickier than originally planned and may impact the longer-term normalization in mobility data along with ramifications in downtown office real estate markets. As Canadians, we’ve learned the hard way that the path is highly dependent on the speed of a vaccine rollout and global case counts. Coronavirus case growth has reaccelerated on a global level, mostly the cause of new variants. However, the case growth has concentrated in Europe, India, Brazil and Canada. This has caused another wave of lockdowns in these regions. But areas leading the way in vaccinations such as the United States and Israel, (chart 5) we are seeing the reopening take place as pent up demand is being sent through the economy as shown by high frequency data. Plus, the higher the vaccine rate the lower the recent case count.
Israel is probably the best example of what heard immunity and an economic reopening looks like. The country has vaccinated over 60% of their population with at least one dose of a vaccine. And unlike areas experiencing the latest wave of infections, they continue to see declining infections, death and hospitalizations cause by the virus. They have been able to achieve these results even with the reopening of cafes, bars and event centers since March 7th.
The majority of vaccinations have taken place in the developed world, making it most likely to see the economic acceleration taking place safely in those regions. However, most developing areas have approached the pandemic with less stringent stay at home orders, thereby minimizing the hindrance on economic activity. The dichotomy of vaccinations and restarts will likely concentrate regions of growth but again produce pockets of opportunity for
stock pickers.
Investment Implications
The re-opening trend is certainly afoot but don’t get too excited from the investment perspective. Equity market performance is a forward-looking mechanism that aggregates everyone’s views. As such, companies that stand to benefit from a continued re-opening and return to more normal times have already rallied pretty hard. Airlines are already one of the top sub-industries in the S&P 500 and many winners of 2020 are now the losers so far in 2021.
Still, while the variants are winning vs. the vaccine pace today, that is likely going to change if Israel and other more rapid vaccine distributing countries are reliable indicators. And as we inch toward the ‘new normal’, 2020 winners will likely continue to lag and those hardest hit continue to recover. There is still some value in these pockets.
Charts are sourced to Bloomberg L.P. unless otherwise noted.
The contents of this publication were researched, written and produced by Richardson Wealth Limited and are used herein under a non-exclusive license by Echelon Wealth Partners Inc. (“Echelon”) for information purposes only. The statements and statistics contained herein are based on material believed to be reliable but there is no guarantee they are accurate or complete. Particular investments or trading strategies should be evaluated relative to each individual's objectives in consultation with their Echelon representative.
Forward Looking Statements
Forward-looking statements are based on current expectations, estimates, forecasts and projections based on beliefs and assumptions made by author. These statements involve risks and uncertainties and are not guarantees of future performance or results and no assurance can be given that these estimates and expectations will prove to have been correct, and actual outcomes and results may differ materially from what is expressed, implied or projected in such forward-looking statements.
The opinions expressed in this report are the opinions of the author and readers should not assume they reflect the opinions or recommendations of Echelon Wealth Partners Inc. or its affiliates. Assumptions, opinions and estimates constitute the author’s judgment as of the date of this material and are subject to change without notice. We do not warrant the completeness or accuracy of this material, and it should not be relied upon as such. Before acting on any recommendation, you should consider whether it is suitable for your particular circumstances and, if necessary, seek professional advice. Past performance is not indicative of future results. These estimates and expectations involve risks and uncertainties and are not guarantees of future performance or results and no assurance can be given that these estimates and expectations will prove to have been correct, and actual outcomes and results may differ materially from what is expressed, implied or projected in such forward-looking statements.
The particulars contained herein were obtained from sources which we believe are reliable, but are not guaranteed by us and may be incomplete. The information contained has not been approved by and are not those of Echelon Wealth Partners Inc. (“Echelon”), its subsidiaries, affiliates, or divisions including but not limited to Chevron Wealth Preservation Inc. This is not an official publication or research report of Echelon, the author is not an Echelon research analyst and this is not to be used as a solicitation in a jurisdiction where this Echelon representative is not registered.
The opinions expressed in this report are the opinions of its author, Richardson Wealth Limited (“Richardson”), used under a non-exclusive license and readers should not assume they reflect the opinions or recommendations of Echelon Wealth Partners Inc. (“Echelon”) or its affiliates.
This is not an official publication or research report of Echelon, the author is not an Echelon research analyst and this is not to be used as a solicitation in a jurisdiction where this Echelon representative is not registered. The information contained has not been approved by and are not those of Echelon, its subsidiaries, affiliates, or divisions including but not limited to Chevron Wealth Preservation Inc. The particulars contained herein were obtained from sources which we believe are reliable, but are not guaranteed by us and may be incomplete.
Assumptions, opinions and estimates constitute the author’s judgment as of the date of this material and are subject to change without notice. Echelon and Richardson do not warrant the completeness or accuracy of this material, and it should not be relied upon as such. Before acting on any recommendation, you should consider whether it is suitable for your particular circumstances and, if necessary, seek professional advice. Past performance is not indicative of future results. These estimates and expectations involve risks and uncertainties and are not guarantees of future performance or results and no assurance can be given that these estimates and expectations will prove to have been correct, and actual outcomes and results may differ materially from what is expressed, implied or projected in such forward-looking statements.
Forward-looking statements are based on current expectations, estimates, forecasts and projections based on beliefs and assumptions made by author. These statements involve risks and uncertainties and are not guarantees of future performance or results and no assurance can be given that these estimates and expectations will prove to have been correct, and actual outcomes and results may differ materially from what is expressed, implied or projected in such forward-looking statements.