Another great quarter to be an investor

The Echelon Insights Team • Apr 05, 2021

Market Recap – yields, value & margin calls


  • For the first half of the quarter, market participants facilitated a run of risk-on activity. The final month, however, was characterized by a pumping of the brakes on high-flying names. While the majority of markets still performed well, there has undoubtedly been a continued divergence in equities between growth & value –more on that later.


  • Despite a continued roll out of vaccinations across the globe, many countries still observed a rise in daily case counts. Countries such as the United States, India, and France have seen an emergence of yet another wave, spurring some additional lockdowns. At the time of writing, Brazil has experienced a 7-day average of ~75k cases daily, more than the United States. Just goes to show that even with vaccine progress, we are far from out of the woods. 


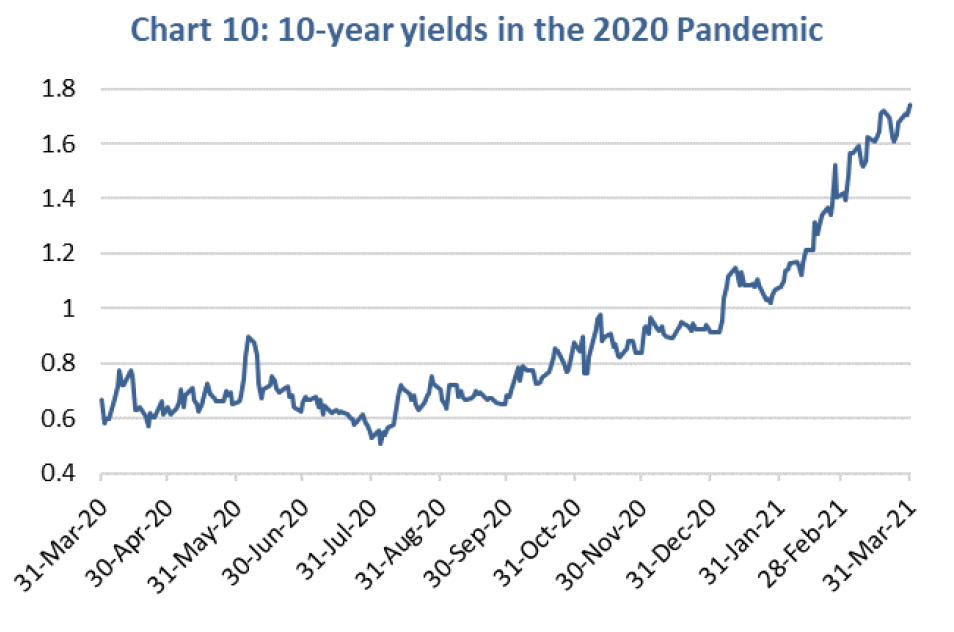
  • The U.S. witnessed a significant rise in the 10-yr Treasury yield, ending the month with a yield of 1.74%, while the Canadian 10-yr finished at 1.56%. Both levels have not been seen since before the COVID pandemic. After the year-to-date date -5% sell-off seen in the FTSE CUBI,the quarterly rebalancing trend seems to favor the buying of bonds. The U.S. dollar index, DXY, posted a March return of +2.6%, marking a four-month high. Strength in the U.S. dollar was certainly not in the consensus playbook heading into the year and a large driver for its recent strength is tied back to weakness for the euro as their vaccination deployment struggles result in more lockdowns.


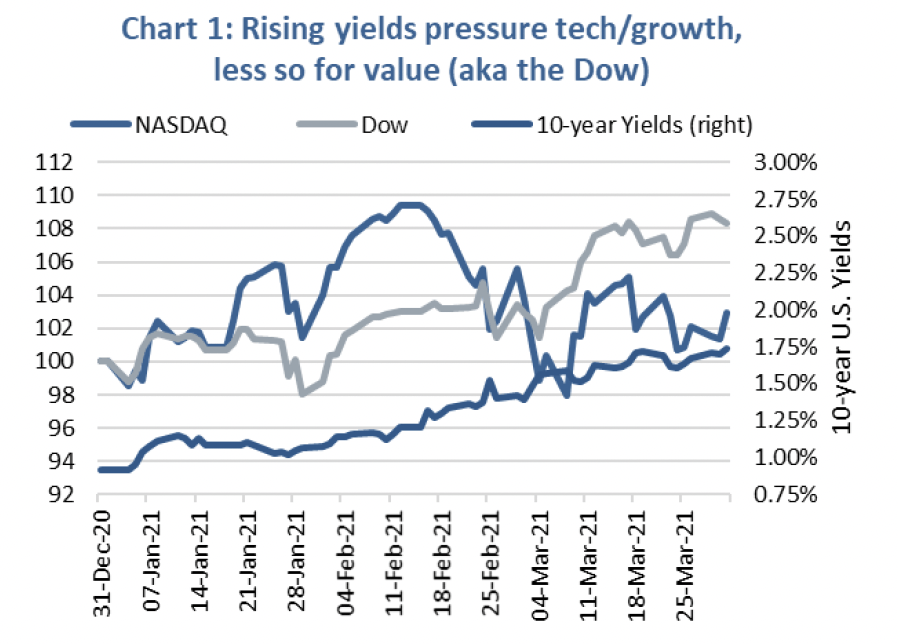
  • The ‘risk-on’ trade fumbled at the 20-yard line as investors choose safer instruments to navigate the field. Despite the possibility of another wave materializing,global markets continue to look the other way. In Canada, the S&P/TSX total return posted a +3.9% month in local currency terms. Across the border, the US$1.9B stimulus helped advance US markets, even with the rise in Treasury yields holding back the tech/growth sectors. In local currency terms, the Dow Jones returned +6.6% for the month while the Nasdaq Composite returned +0.4%, furthering the value-over-growth gap in the month of March (Chart 1). The rally in EM this year has almost been erased as emerging markets declined by 1.6% in USD terms, due to higher global yields and a strong U.S. dollar. 


  • For 6 days, 3 hours, and 38 minutes, the Ever Given was stuck in the Suez Canal, disrupting global trade for an estimated ~$9.6bn/day for a whopping total of ~$59bn. It was ultimately the raw forces of nature that released the stranglehold on the global economy as the moon and tides freed the ship. Elsewhere, a flurry of margin calls from multiple global investment firms triggered fire-sale block trades in a number of companies, many were Chinese tech names plus Viacom CBS and Discovery to name a few (Chart 2). The target of these margin calls was Archegos, a family office that had built up very large and leveraged positions in the names.A stock offering from Viacom earlier in the week triggered the cascading slide and Archegos was forced into a liquidation. 


  • The flurry of activity over the past few months is a good thing for investors. If the market was not volatile, sellers would not exist and buying opportunities for investors would diminish. Looking towards the next three quarters, lets hope for some increased efficiency in vaccine deployment and free-flowing transportation canals. 

Asset Allocation – Market Cycle & Portfolio Positioning


  • Despite the rise of variants, higher yields and structural wobbles in pockets of the market (GameStop + possibly the largest margin call in history), the market and the world is in a better place than it was 3, 6, 9 and most certainly 12 months ago. Vaccine rollouts continue to inject a little market optimism with each jab. Yields are rising for good reason, the economy is improving. Earnings growth is back and we are finally seeing a more healthy rebalancing from growth dominance to a period of value outperformance. 


  • Don’t worry we haven’t gone all ‘pompom shaking bullish’ on you, but even with the S&P 500 at 4,000 and the TSX at 19,000, we still see upside this year in equities. The economic recovery is pretty much in the bag which will help earnings continue to growth, making the current elevated valuations a bit more tenable. 


  • Yields, if they rise too far or too fast, could very easily trigger a risk-off episode or a correction. We believe this would be one of the potential buying opportunities of 2021 as there’s simply too much stimulus and economic momentum to trigger an extended bear market. 


  • The true bear market is out there though, lurking as always, but we believe there is plenty of time. The warning signs could be inflation rising enough that central banks pivot into a tightening behaviour. That’s a long ways off as inflation hasn’t started to rise and the banks remain steadfast on leaving things accommodative for longer. 


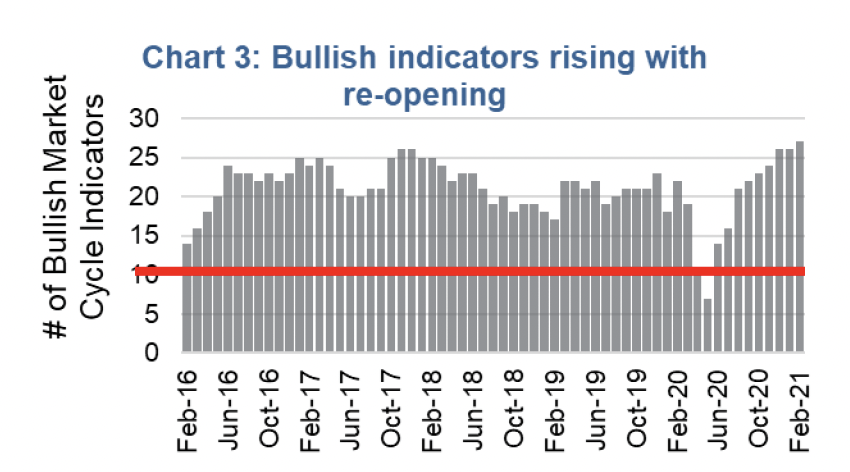
  • Market cycle indicators have rebounded strongly with momentum with global & North American economic indicators and rates largely positive. Valuations metrics remain the source of the few bearish indicators. There is a lot of economic momentum out there. 


Positioning


  • Despite a positive outlook, we remain roughly at our baseline equity allocation. We expect we’ll add more if a yield-induced pullback materializes. Within equities we have an underweight in the U.S., market weight in Canada and overweight globally. Within these allocations we are more value and smaller cap tilted. 


  • Bond allocation is underweight, less duration and more neutral credit exposure. Credit is balanced across investment grade, some high yield
    and preferreds. 


  • We have leaned more towards alternative credit given low yields and risks of continued rising yields from these levels. Plus,weare using alternatives as a source for portfolio stability among the volatility management mandates. Again, as we believe traditional bond allocations will be challenged in the near term, limiting their defensive contribution.  


  • Overall, reasonable exposure should markets continue to climb but also enough thoughtful defense and dry powder in case there is a wobble along
    the way.

Asset Allocation – Currency and Crowded Trades


  • Crowded trades are difficult to detect in real-time but become quite visible in hindsight. At the beginning of the year, a now-apparent consensus trade was being short the U.S. dollar. It was one of the reasons why we favored Emerging Markets exposure in our year ahead outlook. Consensus trades tend to permeate the investment universe, until it seems everyone is on the same side of the trade and the inevitable counter-trend move ensues. As you can see from Chart 5: nearly all major currencies have weakened year-to-date against the U.S. dollar, yet the Canadian dollar has surprisingly been the best performing currency so farin 2021.


  • Why was the crowd wrong? The easy answer is that it underappreciated the newfound sense of stability in the United States: don’t forget that in early January, there was still some lingering political uncertainty. The U.S. has also taken an early vaccine lead which is helping speed the economic recovery, while Europe and Canada are shifting back into lockdowns. Looking at the DXY Index specifically, the Euro is approximately 58% of the DXY Index while the Canadian dollar accounts for just 9%. 


  • The fate of the Canadian dollar is closely connected to the price of a barrel of oil. Chart 6; shows just how strong the relationship between crude prices and the loonie is. From a Purchasing Power Parity perspective, the Canadian dollar, which had previously been deeply undervalued, is now trading at a slight premium to the U.S dollar. The Bank of Canada is also partially responsible for the renewed strength. It’s one of the few central banks that is looking to taper asset purchases. We must stress that they remain exceedingly accommodative but on the spectrum of where central banks lie, they appear not as dovish as others. 


  • Casting our gaze forward, we are less sanguine on the near-term potential of the commodity complex in general given the significant moves over the past six months. Oil is up 51%%, Copper is up 32% and Iron Ore is up 40%. At least in terms of raw materials, it’s hard to foresee prices continuing to appreciate at this pace, especially considering how stretched futures market sentiment already is.


  • From an asset allocation perspective, it’s not about the past three months, or even the next quarter. It often pays to look further out and allocate accordingly. We maintain that longer-term, we expect the U.S. dollar to weaken. This would help the relative performance of non-U.S. stocks when compared to U.S. stocks, one of the factors in our overweight international equity allocation. Europe will get on the other side of the pandemic and we would expect the Euro to appreciate from these levels. Admittedly, the U.S. dollar has some short-term momentum on its side, breaking through its 200-day moving average but it by no means has a clear runway with ample levels of resistance above. Still, it remains a better bid due to higher relative Treasury yields and a nearly vaccine lead. Near-term, we would not be surprised to see this continue but looking out towards the end of the year, we would rather position for the global ‘catch-up’ trade barring any mild risk setbacks.

Asset Allocation – Inflation stirring beneath the surface


  • With nominal bond yields now back to levels on par with before the onset of the pandemic, one of the most important questions for asset allocation is “Where do they go from here?” At the root of this question is inflation. So far during this economic recovery, inflation has remained low and stable thanks to a number of counteracting forces remaining in balance. We believe this will change soon with a near-term cyclical uptick in inflation in the coming quarters and a more secular rise as the decade progresses.


Near-term – we expect some signs of inflation as re-opening accelerates (now to a few years)


  • You don’t have to look very hard to find higher prices (that is inflation) on many things today. From lumber and other commodities to the price of a cup of coffee, prices are up. But at the same time, prices of things such as accommodations, travel (if allowed) are down. This is combining to keep inflation measures subdued.


  • Lower rents, productivity gains (Zoom calls instead of travel) and still-elevated unemployment are putting downward pressure on inflation. These are countering accelerating economic growth due to the re-opening, the impact of stimulus and supply chain issues. Many supply chains reduced output as a rebound this quick was not expected. Add to this pandemic issues plus a God awful parking job in the Suez. 


  • This balance will not last. Assuming the vaccines gradually beat back the pandemic, many of those unemployed will begin working again. The consumer has saved billions, a good portion of which will likely be released when we can go out and eat or travel again. The roaring 20s maybe be
    a foot.


  • We believe this pushes inflation above the 2% level along with higher nominal yields. It’s unlikely this goes too far as there are still secular deflationary pressures and the central banks will act to counter the trend at some point. This could result in a more textbook recession but that is a ways down
    the road. 


  • For now, this is good inflation, building on the back of improving economics and a more normal world. 

Longer-term – there are a number of secular trends that will likely cause higher inflation this decade


  • Technological advances such as autonomous vehicles, high levels of debt and an asset-light economy will be offsetting forces that are likely to persist during the next 10 years and beyond. 


  • But a number of deflationary forces that have been present for much of the past few decades are starting to diminish. Demographics with baby boomers retiring kept inflation low but this is gradually giving way to millennials hitting that key household formation age. Global trade, or more specifically global trade growth, is slowing. Policies to address income disparity and climate change: these are all incrementally inflationary. 


  • Add it all up, we are likely entering a decade that will see a broad trend towards higher inflation, with a few bumps along the way.

Equities – Pandemic induces supply chain evolution


  • The pandemic uncovered –in quick fashion –weaknesses across North American supply chains, exhibited best by masks and toilet paper, and now with vaccines. Our home province of Ontario has only ~2% of its population fully vaccinated, whereas adults in the U.S. now have better access due to superior logistics. 


  • Global authorities are recognizing this vulnerability and are in most cases taking one of two approaches: 1)repatriating parts of the supply chain by bringing manufacturing onto domestic grounds, causing investment shifts and a net loss in productivity, or 2)in situations where marginal costs are close and order volumes are large, diversifying their supply chains globally instead of relying solely on the lowest cost supplier.


  • The prevailing lack of access to brick-and-mortar retail amidst lockdowns throughout 2020 drove e-commerce as a percentage of retail sales to increase +400 bps to 23% last year in the U.S., representing growth that would have taken several years too ther wise materialize based on previous trends. This penetration is likely going to last, but unlikely to grow at the same pace in future years. Some normalization is likely due.


  • Increased e-commerce activity has also led to a rapid rises in less-than truckload shipments –a boon for TFI International –as well as required packaging –which is a growing focus for Transcontinental. It’s also worth noting that 20-30% of e-commerce transactions end in returns. This gives good long-term structural support for small package companies involved in the supply chain this year and beyond. 


  • As much as e-commerce was a win for shipping volumes, this trend has weighed on margins. B2C business is far less profitable than B2B. The return of business-to-business shipping should help improve margin growth as pandemic driven headwinds wane. We note that our portfolio holdings, such as UPS and TFII, did a better-than-expected job passing along these rate hikes and surge charges and still managed to realize productivity gains. 


  • Another tailwind that should persist throughout the rest of the year that we are already seeing evidence of is inventory restocking; the U.S. inventory to sales ratio is far below historical norms (Chart 7) and will likely normalize. However, the aforementioned confluence of factors has led to increased shipping rates and container costs. This has resulted elevated shipping costs for producers and decreased profitability, factors that the likes of toilet paper producers have struggled with as high shipping rates coincided with hoarding by consumers. This has us exploring opportunities of ancillary winners in areas such as rails, container companies, and third-party logistics as more companies are now outsourcing logistics to focus on core parts of their business. 


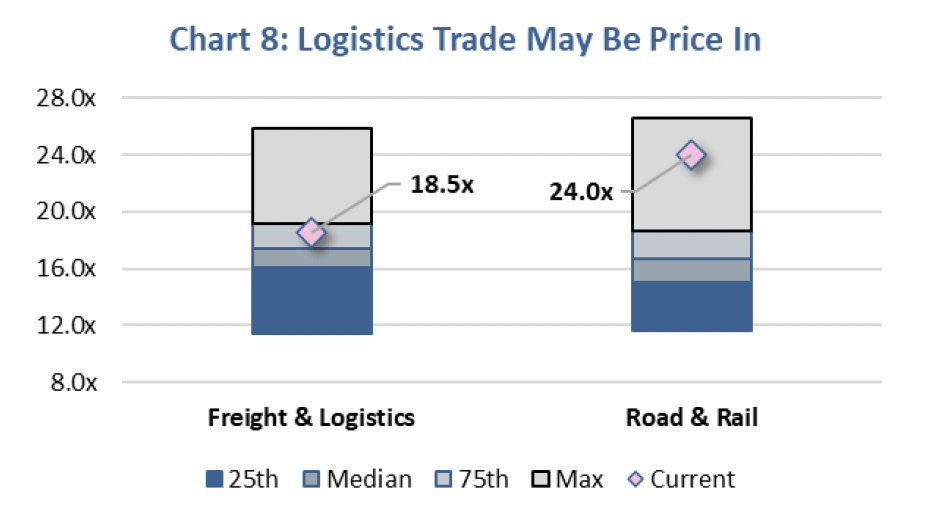
  • Valuations have risen in many of these areas (Chart 8), including our holdings UPS, TFII, TCL/A; however, we think that there still exists a strong fundamental case for the space throughout the rest of the year and beyond. 

Fixed Income – Getting ready for the taper


  • Last year central banks around the globe introduced significant non-conventional monetary policy measures to help alleviate the economic downturn of the pandemic, including significant bond purchase programs.


  • These measures are now starting to be removed. The Bank of Canada is bringing an end to its provincial and corporate bond buying programs, and the US Federal Reserve is requiring US banks to again hold an extra layer of loss-absorbing capital against US Treasuries and central bank deposits.


  • Federal government bond buying programs, however, do remain in place for many central banks and there is no indication of when the pace of purchases will be reduced. We continue to be hopeful that the latest round of lockdowns and ongoing vaccination programs will both lead to a
    quick end to the third wave of the pandemic and a re-opening of the economies of developed nations by the fourth quarter of 2021, which could see this change. 


  • This brings up reminders of the 2013 “taper tantrum” in the US, when the Federal Reserve announced it would be reducing the pace of its purchases of Treasury bonds and the amount of money feeding into the economy. When then Fed Chairman Bernanke announced this intention in the second quarter of 2013, 10-year Treasury yields went from just over 1.60% to 3.00% by year end.


  • Importantly, the reaction to the announcement was more dramatic than the actual event of the tapering. The market prepared for significant reductions in purchases by sending yields higher and then generally absorbed new supply despite lower participation in 2014.


  • We have already seen longer-term yields rise, despite no indication of any near-term change in federal bond purchase programs. This has been driven primarily by inflation expectations, although real yields have also started to move higher in the past few weeks. 


  • Bonds are looking oversold right now as a result of this move and we expect some retracement of these conditions in the coming weeks, seasonally positive for fixed income in the past. Tapering remains a future event, it is expected, and government borrowing requirement can also fall with reduced emergency pandemic spending. 


  • Nonetheless, we do believe that the eventual fall in demand from central banks will have a similar impact on bond yields as happened eight years ago, remaining by far the largest buyers of bonds globally. 


  • Therefore, although the eventual tapering will likely not result in a move in yields as dramatic as in 2013, it will happen and it continues to reinforce our recommendation to stay short in duration and underweight fixed income.

Charts are sourced to Bloomberg L.P. unless otherwise noted.


The contents of this publication were researched, written and produced by Richardson Wealth Limited and are used herein under a non-exclusive license by Echelon Wealth Partners Inc. (“Echelon”) for information purposes only. The statements and statistics contained herein are based on material believed to be reliable but there is no guarantee they are accurate or complete. Particular investments or trading strategies should be evaluated relative to each individual's objectives in consultation with their Echelon representative. 


Forward Looking Statements


Forward-looking statements are based on current expectations, estimates, forecasts and projections based on beliefs and assumptions made by author. These statements involve risks and uncertainties and are not guarantees of future performance or results and no assurance can be given that these estimates and expectations will prove to have been correct, and actual outcomes and results may differ materially from what is expressed, implied or projected in such forward-looking statements.


The opinions expressed in this report are the opinions of the author and readers should not assume they reflect the opinions or recommendations of Echelon Wealth Partners Inc. or its affiliates. Assumptions, opinions and estimates constitute the author’s judgment as of the date of this material and are subject to change without notice. We do not warrant the completeness or accuracy of this material, and it should not be relied upon as such. Before acting on any recommendation, you should consider whether it is suitable for your particular circumstances and, if necessary, seek professional advice. Past performance is not indicative of future results. These estimates and expectations involve risks and uncertainties and are not guarantees of future performance or results and no assurance can be given that these estimates and expectations will prove to have been correct, and actual outcomes and results may differ materially from what is expressed, implied or projected in such forward-looking statements.


The particulars contained herein were obtained from sources which we believe are reliable, but are not guaranteed by us and may be incomplete. The information contained has not been approved by and are not those of Echelon Wealth Partners Inc. (“Echelon”), its subsidiaries, affiliates, or divisions including but not limited to Chevron Wealth Preservation Inc. This is not an official publication or research report of Echelon, the author is not an Echelon research analyst and this is not to be used as a solicitation in a jurisdiction where this Echelon representative is not registered.


The opinions expressed in this report are the opinions of its author, Richardson Wealth Limited (“Richardson”), used under a non-exclusive license and readers should not assume they reflect the opinions or recommendations of Echelon Wealth Partners Inc. (“Echelon”) or its affiliates.


This is not an official publication or research report of Echelon, the author is not an Echelon research analyst and this is not to be used as a solicitation in a jurisdiction where this Echelon representative is not registered. The information contained has not been approved by and are not those of Echelon, its subsidiaries, affiliates, or divisions including but not limited to Chevron Wealth Preservation Inc. The particulars contained herein were obtained from sources which we believe are reliable, but are not guaranteed by us and may be incomplete.


Assumptions, opinions and estimates constitute the author’s judgment as of the date of this material and are subject to change without notice. Echelon and Richardson do not warrant the completeness or accuracy of this material, and it should not be relied upon as such. Before acting on any recommendation, you should consider whether it is suitable for your particular circumstances and, if necessary, seek professional advice. Past performance is not indicative of future results. These estimates and expectations involve risks and uncertainties and are not guarantees of future performance or results and no assurance can be given that these estimates and expectations will prove to have been correct, and actual outcomes and results may differ materially from what is expressed, implied or projected in such forward-looking statements.

Forward-looking statements are based on current expectations, estimates, forecasts and projections based on beliefs and assumptions made by author. These statements involve risks and uncertainties and are not guarantees of future performance or results and no assurance can be given that these estimates and expectations will prove to have been correct, and actual outcomes and results may differ materially from what is expressed, implied or projected in such forward-looking statements. 

Echelon’s Insight Team


Echelon’s Insight Team includes members in various departments such as Wealth Management, Capital Markets, Marketing, Talent, and Compliance who have subject matter expertise and collaborate together to build quality content to help our clients. This team approach helps us ensure content is produced that is meaningful, accurate and timely.

06 May, 2024
Take your pick. There is no shortage of both good and bad news floating about the financial markets. To be fair, this is always the case. The hard part is understanding which side is stronger today and which side will be stronger tomorrow. With markets up low to mid-single digits following a very strong Q4 finish to 2023, most would agree the optimists are carrying the day at the moment. It is not just rose-coloured glasses; there is good news out there. Economic growth signs or momentum appear to be improving year-to-date. Dial back a few quarters, and the U.S. economy remained resilient while other economies softened or were rather lacklustre, including Canada, Europe, Japan, and China, to highlight some of the biggies. Today, while Canada is struggling, momentum in the U.S. has moved even higher, and there are signs of improvement in most jurisdictions.
29 Apr, 2024
There are three things you should rarely ever bet against: the Leaf’s opposing team in the playoffs, the American consumer’s ability to spend, and corporate profits. As we are now about halfway through U.S. earnings season, once again, positive surprises remain the norm; 81% have beaten. It's a bit better than the 20-year average of 75%. The fact is that companies are good at managing analysts’ expectations. At least enough to beat them when the numbers hit the tape. The size of the positive surprises have been encouraging as well, at just under 10%. The highest surprise magnitude in some time.  One of our reservations on the sustainability of this market rally over the past couple of quarters has been the flat earnings revisions. In other words, global markets are up over 20% but earnings estimates have remained flat or tilted down slightly. More often than not, markets trend in the same direction as earnings revisions. Earnings get revised up when companies raise guidance and/or analysts become more encouraged about growth prospects. That is a good thing for markets. Obviously, downward revisions are bad. Yet estimates have remained very flat as markets marched higher, a challenging combination.
22 Apr, 2024
The oil market has been interesting lately and, to the surprise of many, has been the biggest silent outperformer this year. There is no shortage of geopolitical events to choose from that’s leading to a higher risk premium in oil with Brent breaking $90, whether it’s the Houthis missile attacks in the Red Sea leading to a massive re-route of trade, Ukraine’s drone strikes on Russian refineries, and the latest escalation between Israel and Iran leading to some news outlets using WWIII as click bait-y headlines. Given the run-up in oil prices, Canadian oil equities have clearly benefitted from the much higher torque. But there is a layer of even better news: The Transmountain Expansion (TMX) continues to look to be in operation by May, which would lead to much better pricing on the Western Canadian Select (WCS). With the current setup for the oil markets, some key questions that we often get from investors are: How sustainable is the rally in Canadian energy names? To determine if the oil equities are overstretched, we can look at the debt-adjusted cash flow (DACF) multiples of the major integrated oil names and see how the valuation has shifted in light of the recent oil move. From Exhibit 1, the DACF multiples for the Canadian integrated have been fairly range-bound over the last year, also in line with WTI, which has been in the $70 - $85 range. As a starting point, we can infer that the valuations of the companies have been commensurate with the movements in the underlying oil price deck and in line with where the equities should trade in the cycle historically over the last couple of years. Typically, in the commodities cycle, higher prices are usually coupled with lower multiples as market participants will usually price in lower normalized prices and vice versa, so a cause of concern would be if valuation starts trending towards the 6.5x – 7.0x+ area if oil prices continue to stay in the upper bounds of the $70 - $90 range or higher.
MORE POSTS →
Share by: