The market moves in cycles with the two key phases being a bull market (good times) and a bear market (bad times). Determining at which point a bull market begins or ends is never evident at the key turning points. It sometimes takes many quarters or even years before all are convinced ‘that was the bottom’ or ‘that was the top’. Which brings us to the big question of this Ethos: did a new bull market start in late March of 2020 or are we in the same bull market cycle that started way back in March of 2009?
This question is a debate because there isn’t a hard and fast rule for delineating the start or end of a bull cycle. There are some rules of thumb, like that a correction is a 10% market drop while a bear market is a 20% or greater decline. But that would imply the TSX suffered a bear market not just in 2008 but also in 2011, 2015 and of course 2020. In retrospect, some of those don’t feel like they were end of cycles. Perhaps a better delineation from one bull cycle to the next is a bear market for equities (-20% or more) coinciding with a recession (2 quarters of negative GDP growth).
If those are the metrics that signal the end of a bull cycle, then 2020 clearly checks both boxes. Global equities fell 35% and just about every major index was down more than 20% at some point. Some down much much more. In addition, most economies suffered two negative growth quarters. All triggered by the global pandemic. So why the debate?
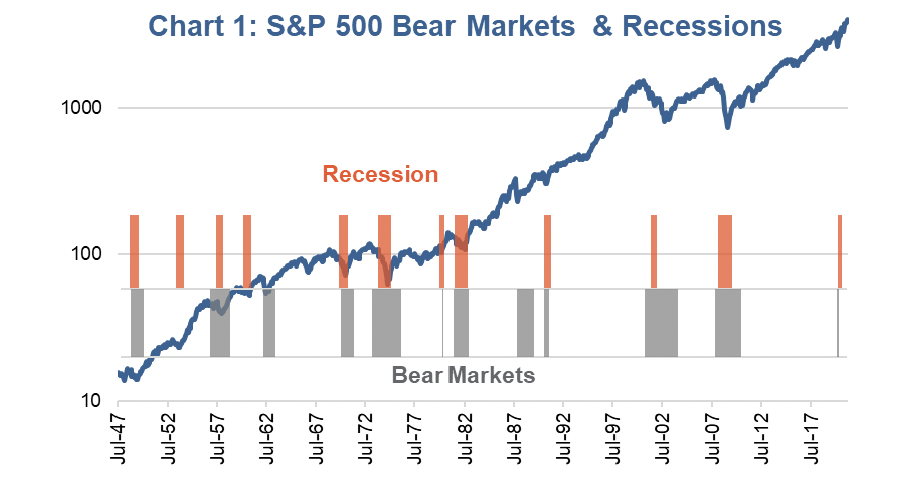
The chart below is the S&P 500 (purple line) with orange bars representing recessions and grey bars bear markets (drop 20% or more). Once the economy begins to grow the orange bar ends. Once the S&P recovers to its pre-bear market level, the grey bar ends. In 2020, there is an orange bar and a grey bar, but note that they are some of the thinnest in history (or quickest).
In the context of historical bull market ending phases that comprise of a recession and bear market, 2020 was over in a flash. It was the quickest recession at two quarters and the second fastest bear market to recovery going back 70 years. Markets are faster today than in decades past, so perhaps that created a faster bear market corrective process. Of course to believe that, you would have to utter those words ‘it’s different this time’.
While every cycle is different and the end of a bullish cycle is different as well. But there are many commonalities that often exist beyond just a recession and a 20% drop in the equity markets at the end of cycle. Most cycles end because the excesses become too great. These excesses have ranged from housing, technology, Japan, commodities, credit, plus others or combinations of a few. The excess or hot part of the economy becomes too great and attracts too much capital. Bad ideas are funded and once reality cannot keep up with expectations, it begins to implode. Initially hurting just the core industry, but then it ripples through the economy and presto, you have a recession and a bear market.
The healing phase often takes time to burn off the excesses: too many homes, too many funded resource companies or a dotcom selling pet food. This rebalancing of the economy and capital takes time and is often painful. None of that occurred in 2020. There were no apparent excesses, this was all caused by an exogenous shock to the system. As a result it would appear there was also no healthy rebalancing of capital and the economy.
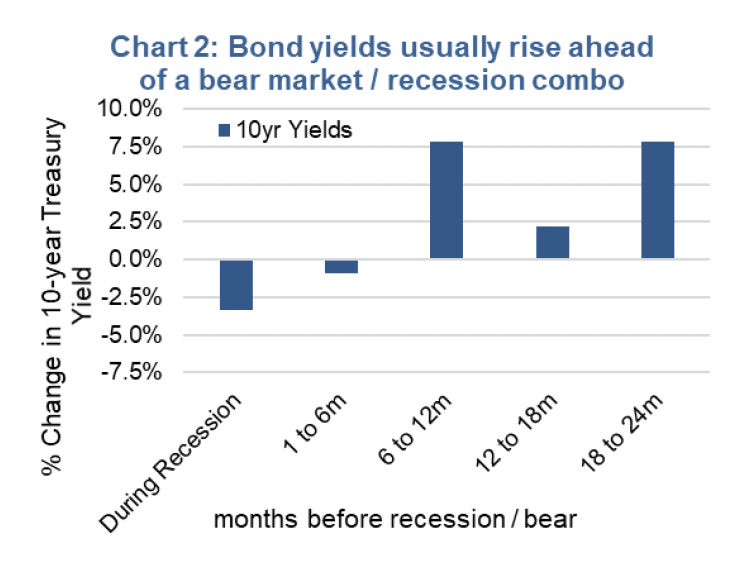
The lead up to this supposed bear market phase was also missing some characteristics. Usually yields are rising materially 6-12 months before the recession / bear market phase (chart 2). In 2019, yields were on a one way road headed lower. Equity markets usually fall before the recession begins (chart 3). This is because the equity market sniffs out economic weakness or the pending rebalancing process. In 2020, markets were up in the six months before the recession hit and even made new highs two months into the recession.
2021 – doesn’t feel like a new cycle
Perhaps the biggest argument that we have not started a new cycle is investor behaviour. Normally equity issuance is slow in the early phases of a new bull cycle. This is because investors are cautious. That’s not the case today. 2020 was one of the best initial public offering (IPO) markets in a long time and with just one quarter of 2021 complete, the trend remains even stronger. ETFs are being launched with catch phrases in their name, immediately attracting millions or billions. There is a speculative fever out there in pockets. Commodity prices are rising materially. This usually doesn’t occur in the early phase of a bull cycle, it is more of a late cycle characteristic.
And then of course there are markets not just making new highs but rocketing higher. Chart 5 is the market cap of all global equities. It is over $111 trillion, up almost 30% from before the pandemic induced bear market. A rise of this magnitude is more akin to late cycle not early cycle.
Investment Implications
This market, this economy, this pandemic … it’s an environment clearly unlike any other. A market peak after a recession begins, unprecedented accommodative monetary policy and fiscal stimulus that started even before the negative economic data was reported, a recession rooted in rapid changes of behaviour from dining out to renovating … oh and saving.
It is possible this was an exogenous shock to the system that triggered a bear market and recession without the cleansing, capital reallocations or resetting that often occurs. Or should occur to create a foundation for the next bull phase [channeling my inner Austrian economist]. Without the cleansing, this shock may have just resulted in extending the previous aged bull cycle, which means we are still late cycle. We could easily point to more excesses in the economy and capital markets today than at the start of 2020 before the pandemic took hold. Which means that there may be a ‘real’ recession on the horizon. The good news is with so much economic momentum, this would unlikely appear anytime soon.
And just to play devil's advocate: this cycle could just be different as they always differ somewhat. It’s worth noting that in 2011, two years after the financial crisis which ended the 2000s bull cycle, many didn’t believe the new bull had begun. The U.S. credit rating was downgraded, Europe was in throes of a debt crisis. Skepticism, or disbelief, is very common one year into a new cycle.
Only time will tell.
Charts are sourced to Bloomberg L.P. unless otherwise noted.
The contents of this publication were researched, written and produced by Richardson Wealth Limited and are used herein under a non-exclusive license by Echelon Wealth Partners Inc. (“Echelon”) for information purposes only. The statements and statistics contained herein are based on material believed to be reliable but there is no guarantee they are accurate or complete. Particular investments or trading strategies should be evaluated relative to each individual's objectives in consultation with their Echelon representative.
Forward Looking Statements
Forward-looking statements are based on current expectations, estimates, forecasts and projections based on beliefs and assumptions made by author. These statements involve risks and uncertainties and are not guarantees of future performance or results and no assurance can be given that these estimates and expectations will prove to have been correct, and actual outcomes and results may differ materially from what is expressed, implied or projected in such forward-looking statements.
The opinions expressed in this report are the opinions of the author and readers should not assume they reflect the opinions or recommendations of Echelon Wealth Partners Inc. or its affiliates. Assumptions, opinions and estimates constitute the author’s judgment as of the date of this material and are subject to change without notice. We do not warrant the completeness or accuracy of this material, and it should not be relied upon as such. Before acting on any recommendation, you should consider whether it is suitable for your particular circumstances and, if necessary, seek professional advice. Past performance is not indicative of future results. These estimates and expectations involve risks and uncertainties and are not guarantees of future performance or results and no assurance can be given that these estimates and expectations will prove to have been correct, and actual outcomes and results may differ materially from what is expressed, implied or projected in such forward-looking statements.
The particulars contained herein were obtained from sources which we believe are reliable, but are not guaranteed by us and may be incomplete. The information contained has not been approved by and are not those of Echelon Wealth Partners Inc. (“Echelon”), its subsidiaries, affiliates, or divisions including but not limited to Chevron Wealth Preservation Inc. This is not an official publication or research report of Echelon, the author is not an Echelon research analyst and this is not to be used as a solicitation in a jurisdiction where this Echelon representative is not registered.
The opinions expressed in this report are the opinions of its author, Richardson Wealth Limited (“Richardson”), used under a non-exclusive license and readers should not assume they reflect the opinions or recommendations of Echelon Wealth Partners Inc. (“Echelon”) or its affiliates.
This is not an official publication or research report of Echelon, the author is not an Echelon research analyst and this is not to be used as a solicitation in a jurisdiction where this Echelon representative is not registered. The information contained has not been approved by and are not those of Echelon, its subsidiaries, affiliates, or divisions including but not limited to Chevron Wealth Preservation Inc. The particulars contained herein were obtained from sources which we believe are reliable, but are not guaranteed by us and may be incomplete.
Assumptions, opinions and estimates constitute the author’s judgment as of the date of this material and are subject to change without notice. Echelon and Richardson do not warrant the completeness or accuracy of this material, and it should not be relied upon as such. Before acting on any recommendation, you should consider whether it is suitable for your particular circumstances and, if necessary, seek professional advice. Past performance is not indicative of future results. These estimates and expectations involve risks and uncertainties and are not guarantees of future performance or results and no assurance can be given that these estimates and expectations will prove to have been correct, and actual outcomes and results may differ materially from what is expressed, implied or projected in such forward-looking statements.
Forward-looking statements are based on current expectations, estimates, forecasts and projections based on beliefs and assumptions made by author. These statements involve risks and uncertainties and are not guarantees of future performance or results and no assurance can be given that these estimates and expectations will prove to have been correct, and actual outcomes and results may differ materially from what is expressed, implied or projected in such forward-looking statements.