Ok, we are not fans of seasonal trends in the market for the simple reason it is never that simple.
Nonetheless, September, which has a history of lower returns and higher volatility, is certainly giving the seasonal supporters strong evidence this year. The S&P 500 has been as high as 4,119 and as low as 3,688; let's call it a 10% variance. And the month is not over. TSX and many other markets are showing similar patterns. 2021 was a great year for investors, and 2022 is turning into the exact opposite, with both equity and bonds losing substantial value.
The root causes are well known and widely discussed. Rising inflation and central bank responses were the original drivers of lower asset prices for equities, bonds, and even real estate. This is now being complemented with fear of a recession ahead and the implications for earnings – which in many cases remain optimistically high. So you have to look pretty hard to find a feel-good narrative. We consume/read a lot of macro-outlooks from internal sources and many from research shops in North America and beyond. The vast majority have a rather pessimistic view of what lies ahead.
So what will put in a floor for this market?
In most bear market cases, the bottom is many months or even a few quarters before economic activity bottoms and many months before earnings growth troughs. So a risk of recession ahead isn't good news, but the market is already pricing in some of that risk. The fact is most bear markets put in a bottom when the root cause begins to improve. In this case, it is inflation. Not saying it must disappear, but if it shows a few months of improvement, that may be enough to kick start a market recovery. After all, if you wait for the 'all clear,' you will likely have missed a lot.
Inflation has not shown signs of improvement, as evident in the most recent U.S. CPI print.
It's worth noting that Canada has seen an early sign of improvement, but it is the U.S. data that matters most.
The next U.S. CPI release is October 13, a few weeks out. In the meantime, there are some survey data on inflation expectations that may provide some insight. Still, probably have to wait for improvement on inflation. But make no mistake, improvement in this area could easily kick start a strong rally in both equities and bonds (dare to dream).
he contents of this publication were researched, written and produced by Purpose Investments Inc. and are used herein under a non-exclusive license by Echelon Wealth Partners Inc. (“Echelon”) for information purposes only. The statements and statistics contained herein are based on material believed to be reliable but there is no guarantee they are accurate or complete. Particular investments or trading strategies should be evaluated relative to each individual's objectives in consultation with their Echelon representative.
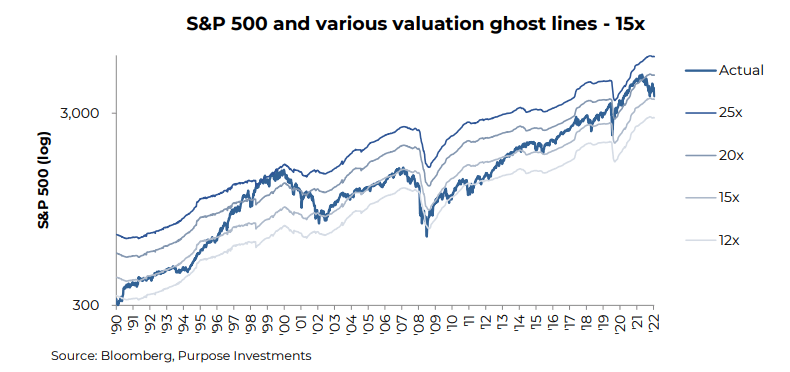
Let’s turn to valuations – During bear markets, valuations can provide a decent signal. No, they don’t ever mark a bottom, but as prices fall and valuations improve, the downside risk declines as upside potential rise. For example, if you buy something at $8 instead of $10, your expected return has improved (but it could still be negative, just less negative than the $10 entry). – During bear markets, valuations can provide a decent signal. No, they don’t ever mark a bottom, but as prices fall and valuations improve, the downside risk declines as upside potential rise. For example, if you buy something at $8 instead of $10, your expected return has improved (but it could still be negative, just less negative than the $10 entry).
Valuations have improved even for the more expensive S&P 500. There are solid reasons the U.S. market should trade at a premium. Historically it has; the breadth of companies is very enviable relative to most other major market indices. The U.S. does benefit from good energy and food security. But is it cheap? Not really.
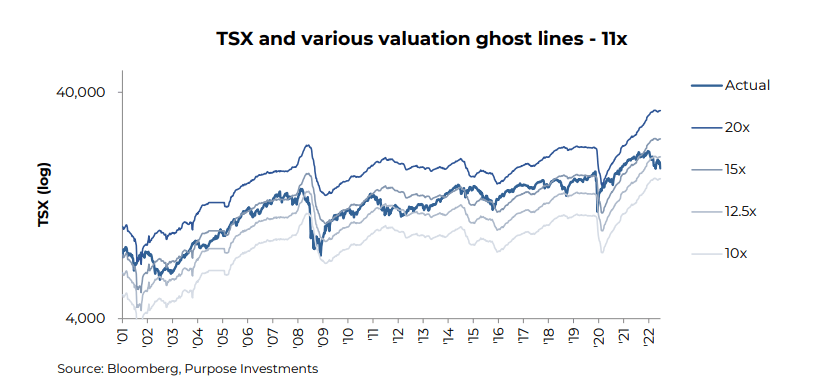
The two charts below are for the S&P 500 and TSX, including valuation ghost lines. These finer lines show where the index would be trading at various multiples. The S&P 500 has seen its multiple fall approaching 15x. Not cheap, but certainly better value than years past. There should be some multiple compression given higher yields, and the big question is whether this is enough.
We would also point out that forecast earnings growth at 15% over the next year still appears overly optimistic.
Canada, on the other hand, is now trading down to 11x earnings. Yes, a bigger chunk of those earnings is from much more cyclical sectors such as energy and materials. But the TSX is certainly pricing in a more muted outlook.
Earnings growth priced in for the next 12 months is 10%, also more reasonable. International markets are also nearing the cheap end of the spectrum.
In our view, this does provide a better margin of safety for Canada and international markets relative to the U.S. It doesn’t mean markets are about to bottom, just that medium return expectations from these valuation levels are tilted to the upside of normal.
And now sentiment – During market extremes, sentiment tends to trump valuations, fundamentals, economics and often common sense. There is no denying markets are oversold, and no denying sentiment is near extreme bearishness (which is bullish). Take your pick:
The AAII investor survey is showing the most bearish 61% since the 70% reading on March 5, 2009 (note the S&P bottomed on March 6, 2009). The chart below is the four-week average bulls minus the bears, which currently sits at -32. Readings at these levels tend to imply a strong market advance during the subsequent 12 months. However, during 2008 there were many signals this bearish before the market ever bottomed. It just goes to show things work most of the time but not all of the time.
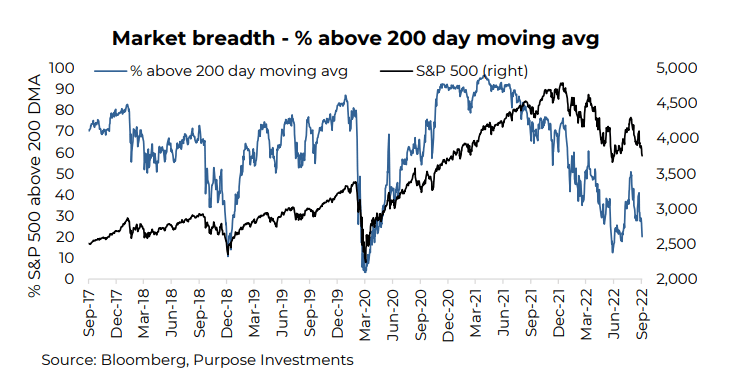
Market breadth is also flashing buy signals. The percentage of S&P 500 companies trading below their respective 200-day moving averages is 20% which will go even lower by the close on Friday, September 23, as the S&P is down more than 2%. Of course, breadth can go lower, and it was slightly lower in mid-June before the S&P rallied over 15%. Still, this is an extremely bearish reading which is bullish.
Portfolio Construction
Our fall strategy remains intact. After reducing U.S. equity in mid-August as it was believed to be a temporary bear market rally, we had raised cash. The expectation is for inflation to begin to fade sometime soon while recession talk grows louder. We expect to deploy some of the raised cash when this begins, as a strong rally could result from inflation rolling over. The current sentiment readings are encouraging, as just about everyone is bearish. But no big moves just yet.
Note: we will, of course, publish once we have made any changes, but our path may vary as it remains data-dependent.
— Craig Basinger is the Chief Market Strategist at Purpose Investments
Source: Charts are sourced to Bloomberg L.P. and Purpose Investments Inc.
The contents of this publication were researched, written and produced by Purpose Investments Inc. and are used by Echelon Wealth Partners Inc. for information purposes only.
This report is authored by Craig Basinger, Chief Market Strategist, Purpose Investments Inc.
Disclaimers
Echelon Wealth Partners Inc.
The opinions expressed in this report are the opinions of the author and readers should not assume they reflect the opinions or recommendations of Echelon Wealth Partners Inc. or its affiliates. Assumptions, opinions and estimates constitute the author's judgment as of the date of this material and are subject to change without notice. We do not warrant the completeness or accuracy of this material, and it should not be relied upon as such. Before acting on any recommendation, you should consider whether it is suitable for your particular circumstances and, if necessary, seek professional advice. Past performance is not indicative of future results. The comments contained herein are general in nature and are not intended to be, nor should be construed to be, legal or tax advice to any particular individual. Accordingly, individuals should consult their own legal or tax advisors for advice with respect to the tax consequences to them.
Purpose Investments Inc.
Purpose Investments Inc. is a registered securities entity. Commissions, trailing commissions, management fees and expenses all may be associated with investment funds. Please read the prospectus before investing. If the securities are purchased or sold on a stock exchange, you may pay more or receive less than the current net asset value. Investment funds are not guaranteed, their values change frequently and past performance may not be repeated.
Forward Looking Statements
Forward-looking statements are based on current expectations, estimates, forecasts and projections based on beliefs and assumptions made by author. These statements involve risks and uncertainties and are not guarantees of future performance or results and no assurance can be given that these estimates and expectations will prove to have been correct, and actual outcomes and results may differ materially from what is expressed, implied or projected in such forward-looking statements. Assumptions, opinions and estimates constitute the author’s judgment as of the date of this material and are subject to change without notice. Neither Purpose Investments nor Echelon Partners warrant the completeness or accuracy of this material, and it should not be relied upon as such. Before acting on any recommendation, you should consider whether it is suitable for your particular circumstances and, if necessary, seek professional advice. Past performance is not indicative of future results. These estimates and expectations involve risks and uncertainties and are not guarantees of future performance or results and no assurance can be given that these estimates and expectations will prove to have been correct, and actual outcomes and results may differ materially from what is expressed, implied or projected in such forward-looking statements. Unless required by applicable law, it is not undertaken, and specifically disclaimed, that there is any intention or obligation to update or revise the forward-looking statements, whether as a result of new information, future events or otherwise. Before acting on any recommendation, you should consider whether it is suitable for your particular circumstances and, if necessary, seek professional
advice.
The particulars contained herein were obtained from sources which we believe are reliable, but are not guaranteed by us and may be incomplete. This is not an official publication or research report of either Echelon Partners or Purpose Investments, and this is not to be used as a solicitation in any jurisdiction.
This document is not for public distribution, is for informational purposes only, and is not being delivered to you in the context of an offering of any securities, nor is it a recommendation or solicitation to buy, hold or sell any security.