The path to the greatest wealth creation is to load up a portfolio into one security – you just have to pick the right one.
Ask Jeff Bezos or Bill Gates. Unfortunately, choosing the right one is either impossible or luck with incredibly impossible odds. Ask Christian Gronet or Julie Wainwright, lesser�known innovative founders who just didn’t make it [Solyndra & Pets.com]. So, investors opt for the safer and more reliable plan B to reach their long-term goals. Instead of shooting for the stars, invest in a well-diversified portfolio.
Diversify by style, geography, and, most importantly, asset class. The biggest component for most portfolios is asset class diversification, primarily the combination of equities/stocks and bonds.
The foundational reasons to combine stocks and bonds are pretty intuitive. If the economy is doing well, earnings are growing, which helps the stock market perform well. But an economy that is doing well is inflationary, which pushes up yields, hurting bond prices. If the economy is doing poorly, well, the opposite should occur with stocks down and bonds up. So,
stocks and bonds should be negatively correlated and provide great diversification, if combined, the mythical smooth ride.
If only investing were that easy or simple. The fact is, there are many factors at work, and this results in changing correlations between asset classes over time. Today, we are going to talk stock and bond correlations. For the obvious reason, there are many upset investors (and portfolio managers) that don’t like the fact that stocks and bonds have been moving in the same direction as one another (positively correlated). Everyone expects a degree of volatility in equities, but it sure helps the portfolio during periods when equities are going down if your bonds go up. That has not been the trend of late.
he contents of this publication were researched, written and produced by Purpose Investments Inc. and are used herein under a non�exclusive license by Echelon Wealth Partners Inc. (“Echelon”) for information purposes only. The statements and statistics contained herein are based on material believed to be reliable but there is no guarantee they are accurate or complete. Particular investments or trading strategies should be evaluated relative to each individual's objectives in consultation with their Echelon representative.
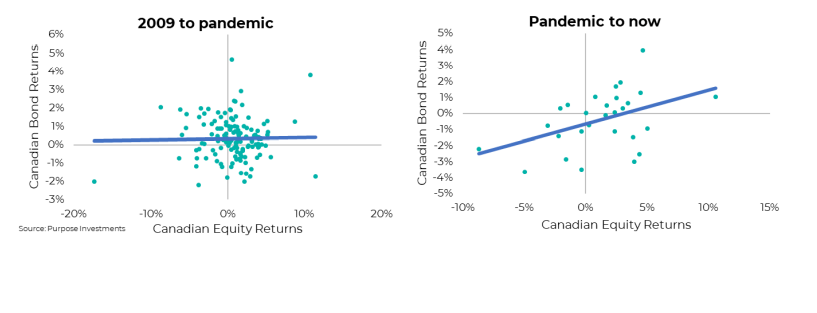
It is pretty easy to see in the above scatter plots of monthly stock/equity returns vs bond returns [the purple line is the trend]. From 2009 until the onset of the pandemic in March 2020, monthly returns between stocks and bonds were really all over the place and didn’t show much of an underlying relationship. This would be ‘uncorrelated,’ which helps a portfolio’s diversification as the two assets behave rather independently. Now the chart on the right from the onset of the pandemic until now shows a different pattern. Only two months had stocks down and bonds up. And there are many months that both stocks and bonds were lower or higher together. Again, this provides less diversification benefit if they are moving in the same direction.
So, have market dynamics changed to neutralize the benefits of combining stocks and bonds in a portfolio? Not so fast. First off, there are so many strange dynamics afoot in the markets today. Given the lingering reverberations caused by the pandemic, jumping to conclusions is not a good idea. Especially throwing out decades of data because of a year or so. The fact is, correlations do change over time, and they are currently more positive.
Truthfully, correlations between stocks and bonds have been positive for a few years now, not just in 2022. Nobody seemed to mind the positive correlation when stocks and bonds were moving higher together. As you can see in the above chart, from 2000-2020, correlations were low or negative for the majority of that period. Not so in the 1990s or earlier.
So, if correlations are going to remain high, does this negate the benefit of stock and bond diversification? No. It may soften the benefit, but correlation measures direction, not magnitude. That is where beta comes in, measuring the degree of the move in stocks and bonds (thin black line in the above chart).
Over the past two years, the correlation between bonds and stocks has risen to roughly 0.5, but the beta remains low at about 0.2. Meaning if your stocks fall 5%, bonds should fall by 1%. Since down 1% is better than down 5%, there is still a benefit.
Plus, the high correlation won’t stay high, either. One factor that does appear to have a strong relationship with the stock-to-bond correlation is the variability in central bank rates. When central bank rates are moving, the stock-to-bond correlation tends to be much higher. When central bank rates are stable, the stock-to-bond correlation tends to be much lower. This certainly makes sense. Changes to the central bank overnight rate changes the risk-free rate, either up or down. The risk-free rate is a component in the valuation of both stocks in bonds, so changes impact both asset classes in the same direction.
Portfolio Construction
Given the outlook for central bank rates certainly points to continued action in the current fight against inflation, the bad news is this will contribute to keeping the stock-to-bond correlation higher. That being said, a higher correlation isn’t always bad. When inflation starts to roll over, the market will likely start to price in a cooling of the overnight bank rate, which may very well lift the prices of both stocks and bonds simultaneously. Yay, positive correlation.
The yin and yang of stocks and bonds aren’t broken. Maybe people just thought it was a hard rule or constant instead of a variable relationship over time. The diversification benefits between stocks and bonds may not be as strong as in years past, but they will be again. Certainly, explore ‘new’ diversification strategies, but please don’t mess with the core of portfolio construction because of a couple of years of data. Besides, buying bonds that yield 5% does feel a lot safer than buying them a few years ago, yielding 2%. Not saying we love bonds, but we sure don’t dislike them anymore.
— Craig Basinger is the Chief Market Strategist at Purpose Investments
Source: Charts are sourced to Bloomberg L.P. and Purpose Investments Inc.
The contents of this publication were researched, written and produced by Purpose Investments Inc. and are used by Echelon Wealth Partners Inc. for information purposes only.
This report is authored by Craig Basinger, Chief Market Strategist, Purpose Investments Inc.
Disclaimers
Echelon Wealth Partners Inc.
The opinions expressed in this report are the opinions of the author and readers should not assume they reflect the opinions or recommendations of Echelon Wealth Partners Inc. or its affiliates. Assumptions, opinions and estimates constitute the author's judgment as of the date of this material and are subject to change without notice. We do not warrant the completeness or accuracy of this material, and it should not be relied upon as such. Before acting on any recommendation, you should consider whether it is suitable for your particular circumstances and, if necessary, seek professional advice. Past performance is not indicative of future results. The comments contained herein are general in nature and are not intended to be, nor should be construed to be, legal or tax advice to any particular individual. Accordingly, individuals should consult their own legal or tax advisors for advice with respect to the tax consequences to them.
Purpose Investments Inc.
Purpose Investments Inc. is a registered securities entity. Commissions, trailing commissions, management fees and expenses all may be associated with investment funds. Please read the prospectus before investing. If the securities are purchased or sold on a stock exchange, you may pay more or receive less than the current net asset value. Investment funds are not guaranteed, their values change frequently and past performance may not be repeated.
Forward Looking Statements
Forward-looking statements are based on current expectations, estimates, forecasts and projections based on beliefs and assumptions made by author. These statements involve risks and uncertainties and are not guarantees of future performance or results and no assurance can be given that these estimates and expectations will prove to have been correct, and actual outcomes and results may differ materially from what is expressed, implied or projected in such forward-looking statements. Assumptions, opinions and estimates constitute the author’s judgment as of the date of this material and are subject to change without notice. Neither Purpose Investments nor Echelon Partners warrant the completeness or accuracy of this material, and it should not be relied upon as such. Before acting on any recommendation, you should consider whether it is suitable for your particular circumstances and, if necessary, seek professional advice. Past performance is not indicative of future results. These estimates and expectations involve risks and uncertainties and are not guarantees of future performance or results and no assurance can be given that these estimates and expectations will prove to have been correct, and actual outcomes and results may differ materially from what is expressed, implied or projected in such forward-looking statements. Unless required by applicable law, it is not undertaken, and specifically disclaimed, that there is any intention or obligation to update or revise the forward-looking statements, whether as a result of new information, future events or otherwise. Before acting on any recommendation, you should consider whether it is suitable for your particular circumstances and, if necessary, seek professional
advice.
The particulars contained herein were obtained from sources which we believe are reliable, but are not guaranteed by us and may be incomplete. This is not an official publication or research report of either Echelon Partners or Purpose Investments, and this is not to be used as a solicitation in any jurisdiction.
This document is not for public distribution, is for informational purposes only, and is not being delivered to you in the context of an offering of any securities, nor is it a recommendation or solicitation to buy, hold or sell any security.