For the first half of the quarter, it looked hopeful that the markets were through the worst of it.
By the midpoint of the quarter in August, both the S&P/TSX & S&P 500 were both chugging along nicely, up +7.8% and +13.9% (USD), respectively. However,
at that midpoint, the bounce off the mid-June lows ran out of steam due to stubborn inflation and hawkish central banks. After that strong rally, we are left in a slightly negative position to close out the quarter. In Canada, the TSX finished down -1.4% and the S&P 500 finished slightly worse,
down -4.9%. With both indexes touching or brushing up against fresh lows for this bear market, there could surely be more selling to come. Market drawdowns in the US were not drastically in favour of growth or value either; in fact, value surprisingly finished marginally worse than growth over the quarter by about 2.0%.
That is not something you would expect in a rising rate environment but is something you would expect in the final stage of a bear market that sees more indiscriminate selling.
For the last month and a half, the challenges of being an investor have ramped up. Everything was down, including a continued downtrend in the bond market, albeit showing more stability than earlier in 2022. The all- important US 10-year yield started the quarter at 3%, down to 2.55%, and then up to nearly 4%. Nothing short of breathtaking. Unfortunately, it’s not the type of shortness of breath you experience when you witness a stunning landscape, but rather the type you feel when you get punched in the gut unexpectedly. Credit spreads have been rising at a steady pace, but if inflation persists and slower growth avails, balance sheets and cash flows will grow in importance. If we are going to go into a recession, credit spreads likely still have much more room to run.
The contents of this publication were researched, written and produced by Purpose Investments Inc. and are used herein under a non- exclusive license by Echelon Wealth Partners Inc. (“Echelon”) for information purposes only. The statements and statistics contained herein are based on material believed to be reliable but there is no guarantee they are accurate or complete. Particular investments or trading strategies should be evaluated relative to each individual's objectives in consultation with their Echelon representative.
September lived up to its historical nature of increased weakness and volatility, posting the worst month of September since 2011. For the S&P 500, the number of months that posted a return of -3.0% or worse in a year is elevated and close to reaching all-time levels. In fact, with three months remaining in the year, if two of those three months post weaker drawdowns than -3.0%, we will have achieved the most in history. Not sure if that counts as an achievement, but hey, impressive feats can happen on both ends of the spectrum. Let’s not forget in 2021, the S&P 500 was up +29%.
Internationally, the situation has become grimmer as the war continues between Russia and Ukraine. When the conflict began in February, many of us expected the situation to be resolved quickly, but to say the least, Ukraine has put up a fight. Most recently, the Russian leader, Vladimir Putin, has stated that they will take any measures to defend Russia’s land.
There has been a more fiscally dire situation in Europe as the UK continues to melt down. A policy change to increase growth by borrowing billions and cutting taxes has not had the intended effect. Over the last six months, the British pound has lost about 20 cents against the USD, and while some of this is due to USD strength, the most recent freefall can be more attributed to the new policy.
The chart below is not a cryptocurrency or a Ponzi scheme. Instead, it is a 40-year UK government bond.
It is difficult to imagine what it would feel like to buy a bond ten months ago, very close to par, and to watch it decline to $25, but the reality is there are surely investors out there who have felt this pain. This very long-term bond has recovered to $37, but still not something to celebrate. Oh, and the icing on the cake is the bond only yields about 3.4% even after the decline.
With so much global uncertainty, the safe haven US dollar has risen exponentially. When looking at the US Dollar Index (DXY), it has risen back to levels not seen since 2002.
A higher USD causes many global issues, resulting in economic officials deploying several methods to prop up their currencies. High inflation and weak currencies are a double whammy for the costs of importing products. For now, this is not a problem for the US, which continues to stay super hawkish, and a plan for a pause or pivot from rate hikes continues to be pushed out further. On July 1, the peak implied rate sat at 3.4%, expected to be reached by February 2023. Moving to today, peak rates are expected to be reached by March 2023, at a rate of 4.4%, which is a huge gain of +100 bps over the last three months.
Another safe haven asset has not done as well as one would have hoped. Gold continues to be pressured under the rise of the US dollar. Sentiment for the precious metal continues to be bearish as the Fed shows no signs of slowing down its pace of rising rates. Gold spot has fallen around -19% since the 1-year peak in March, continuing to be pinned at levels not seen since April 2020.
A couple of consecutive negative GDP prints bring concerns about slowing growth to the end of the year. Q3 Earnings are right around the corner in October, where expectations have been declining and still have a strong chance to be worse than expected. While there is some hope that inflation has peaked, the stubborn readings can still damage the bottom line. Supply chain problems persist in the economy as well, causing companies to struggle with meeting demand. While the outlook for economic conditions and markets remains grim, staying invested and managing risk along the way is always the preferred long-term game plan.
When does a bear market end?
The obvious answer to this rather important question is it ends when the next bull market begins. And unfortunately, there is no simple or consistent metric given each bear market is different. Some bear markets see markets drop a breathtaking 40-50%, or even more. Not great news, considering the S&P is down 25% and TSX off by 17%. Fortunately, some are much shallower (there is always hope). Some last several years, while others last a couple of months.
There is no valuation metric or sentiment score that marks the bottom. The last four bear markets troughed at S&P 500 price-to-earnings multiples of 10x, 14x, 9x and 14x, with the market currently sitting at 15.5x. Worse yet, trough valuations did not always coincide with the market price bottom as earnings are a moving component of the PE ratio. Sentiment is very bearish right now, which is bullish. Not lost on us the last time the AAII investor survey showed over 60% bearish was a few days before the bottom in March of 2009. However, it was also over 60% bearish in October of 2008, with five long months and another 25% of pain to go before the bottom.
Hell, even after the market bottom has been put in, it is rarely believed. The market rallies, all the while the vast majority of investors and market pundits fret that it is simply another bear market rally. Doom and gloom remain the persistent narrative.
Bear markets are similar to recessions – you don’t know they are over until well after the fact.
But all is not lost. One common occurrence of a bear market bottom is the route cause of whatever triggered the bear market begins to show signs of improvement. Now we could debate the cause of this bear market but believe most would agree it is that inflation got out of control. Central banks are not raising rates and reversing stimulus because they don’t like investors or are trying to wreck your home’s value – it is in response to inflation.
When (not if) inflation begins to come back down, we think markets will rally pretty strong. Both equities and bonds. This may very well mark the end of the bear market, even if a recession or earnings recession looms on the horizon. Stock market bottoms rarely coincide with the trough in economic activity. In most cases, the market bottoms well before the economy, often by months or quarters. This bear was caused by inflation; an improvement of this root cause should not be underestimated.
Of course, there is a ‘but’ to this. Inflation has not started to improve, and one monthly print may not solidify a new trend. So, even if improving inflation has the potential to mark the bottom of the bear, it is at a minimum a few months from now or potentially longer. And in the meantime, the economic data and earnings data will likely continue to show downward trends at a time when market stresses are elevated due to wild currency swings, big moves in yields and, of course, lower markets. To put it more plainly, we do not think today is the bottom, but it is getting closer.
Market Cycle
We have some encouraging news but first, a quick recap of what our Markey Cycle indicators are trying to provide.
If you wait for the IMF or consensus economists to let you know a recession is coming, this is too late from an investment perspective as the markets have likely already moved or turned. Our Market Cycle indicators are a vast array of economic, sentiment, fundamental, and interest rate data points.
However, most of the signals, either bullish or bearish, are rate of change. Meaning the momentum in the forward-looking indicator is getting better or getting worse. For instance, if US employment rises by 0.5%, that indicator turns bearish. We could very well still be at very low unemployment levels, but it’s the rate of change that matters. The economy is like dominos; when one starts to roll over, it crashes into another. Housing sales activity weakens first, then prices, then building activities and employment loss. Feedback loops and knock-on effects are what tend to move the economy in one direction or another.
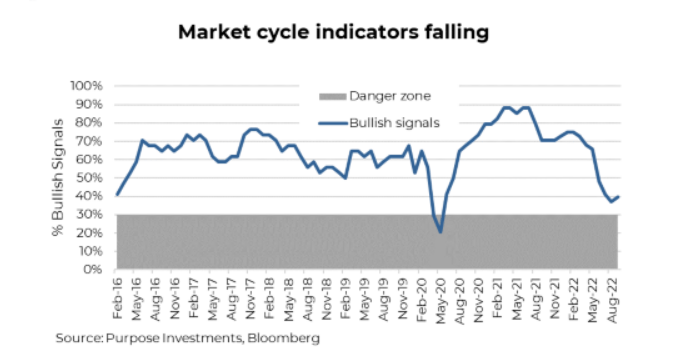
Back to our good news – the indicators have stabilized just above what has historically been the danger zone for a pending recession. No denying the downward trend has been pretty fast (chart). The global economic indicators have been bearish for quarters, and the US has started to weaken as well of late. Still a mixed bag on the US side with housing weak, manufacturing still holding in, but the trend is slower activity. The improvement came from market fundamentals; valuations have come down while earnings revisions have been holding for now.
Being this close to the danger zone is not good. And given the news flow, we believe more indicators will turn negative than positive in the coming weeks. The impacts of tighter financial conditions are increasingly being felt in the economy, and it is starting to manifest in company earnings or comments.
Still, this is a unique cycle and environment, given the emergence of the pandemic. And no denying this bear market remains more about inflation than a recession. This focus will likely change in the coming months as recession risks are likely to continue to rise with markets already down on inflation and higher yields, which lifted the discount rate for all assets, causing asset price declines across all asset classes. The question is should we fear a recession? We would say not as much as in a normal cycle. A lower or depressed starting point, the current market levels, does reduce the market reaction to recessions. Recession, or recession risk, is never good news, but a good portion of this is already priced.
There is also part of us that believe a mild recession would be cathartic. It would reduce inflation pressures and help yields come lower from current levels. It would also address the tight labour situation and a, shall we say, elevated sense of entitlement.
Portfolio Construction
Headwinds remain firmly in place, though with sentiment at extremes and markets oversold, we could be nearing an inflection point where the markets have overshot, pricing in a more dire scenario than what may unfold. Symmetrical moves in the market are commonplace, and like a compressed spring, a market that has been pushed too far can suddenly release its energy. You know, like a spring.
After reducing equity exposure in August, our overall portfolio tilt remains neutral, with an overweight in cash. The global economy is slowing, but a recession has yet to manifest. Earnings estimates are still not reflecting a recession scenario. The benefit is that cash, or short-term money market securities, now provides a decent yield, the highest in over a decade, but more importantly, it provides liquidity and optionality.
Yes, our cash is liquid, not locked into a multi-year GIC, which appears to be the talk of the town among many investors frustrated with the performance this year. Especially the bond performance. The uptick in yield from locking in is not worth it, in our view. If yields rise further, liquid cash will follow the higher yield, which GICs won’t. And if inflation starts to cool, we have daily liquidity to adjust our asset mix.
Our allocations are historically far from static and have not changed materially from last month. We remain cautious; however, we are fully aware that when sentiment is extreme, the winds can change at a moment's notice. This could be a better-than-expected inflation print or perhaps an unexpected tonal shift from a central banker [which would likely be the result of the data]. For now, markets are fully comfortable being uncomfortable. Not knowing how far rates will have to rise, where the terminal rate is, and how long the recent tightening will take to show up in the economic data.
Equities
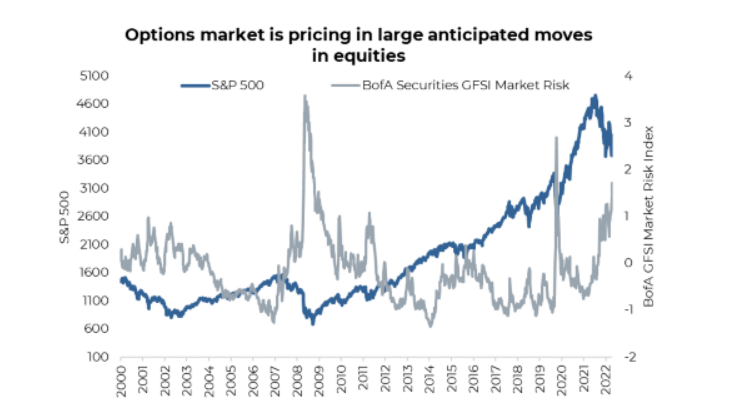
Uncertainty breeds volatility, and volatility is now as prolific as talking about House of Dragons on a Monday morning zoom call. Volatility across equity markets is reflected by the risk of future price swings, which recently reached the highest level since the beginning of the pandemic, as shown in the chart below by a Bank of America index. These volatility spikes are typically short-lived and often coincide with market bottoms. For now, we remain cautious, with a neutral equity weighting. There could be an opportunity for another tactical bounce in growth similar to what occurred in the summer; however, we’re comfortable letting the markets make the first move.
From this point forward, equities are really going to take their cues from the bond market and the inflation data.
So if you see bond yields move lower, that is a good sign for equities.
Canada
While the safety trade of the US dollar could persist for more months or quarters, even in Canadian dollar terms, Canadian markets have been a better refuge for investors than many other international markets. Year- to-date, the S&P/TSX Composite is down just 11% and has thus far evaded a bear market. We remain neutral on Canada, but any reversal in the risk-off trade could become a strong tailwind for Canadian stocks. The relative strength of Canada is largely an Energy question. The sector carries a 17% weight, and besides, Consumer Staples has been the lone pillar of positive contribution.
Oil has sold off 20% in just two months. However, it’s at or approaching a level that, barring a long and painful recession, we can see a path higher from here, given US SPR releases are set to end in a month. There has been little headway on an Iran agreement, and sanctions on Russia will continue to dampen supply. A drop in the US dollar would also be a welcome tailwind. Saudi Arabia and their allies are currently in the driver’s seat and could successfully defend.
We remain concerned over recession risks in Canada and the impact a slowing housing market will have on the economy as well as the banks. However, valuations are quite depressed and do provide a margin of safety.
US
In August, we reduced our allocation to US equities after growing wary of the strong advance, particularly in the tech-heavy NASDAQ. We expect volatility to linger with looming mid-term elections and a hawkish Fed. From a seasonality standpoint, the months preceding mid-term elections have a rather poor track record, but this reverses after the election. The spread in global valuations also has us wary that value investors may see better opportunities abroad, given an expensive US dollar and US valuations still sitting at levels far from what we would consider cycle lows. The current PE for the S&P 500 is 16.5x forward earnings compared with 11.4x for the TSX and 11.2x for the MSCI EAFE Index. The elevated spread has been in place for the past couple of years and leaves US equities still very expensive on a relative basis. The Fed remains aggressively hawkish, which is an additional factor to consider.
International
Some pre-conditions for a market bottom are beginning to fall into place, especially in international markets. Outside the US, stocks are increasingly looking cheap and approaching value territory. Positioning and sentiment are extremely depressed, as seen in the above valuation chart.
Europe remains structurally challenged amid an energy crisis, war on its border and currency woes that have brought the euro and the British pound to near parity with the US dollar. Currency moves have been a large component of negative returns this year. Year-to-date, the MSCI EAFE Index is down 27%, Europe is down 21%, and Japan is down -8%. Excluding currency weakness, all of these markets are actually outperforming the US.
Given the structural challenges present in Europe, we continue to favour Japan. The yen is extremely undervalued as the BoJ is thus far not following the footsteps of other central banks. The Nikkei has been rather strong this year, outperforming even the commodity-heavy TSX and is down just 6.6% in local terms. This compares to -25% YTD in US dollars. The underlying industry exposure in Japan is heavy on Autos, Pharmaceuticals, Banks, Industrials, as well as Telecom companies. A nice blend of domestic defensives and export-oriented companies that suddenly find their products more price competitive on a global market, given the yen's decline.
Our base case remains that the Yen weakness will first slow, then subside with a BoJ policy shift. The current tension between the BoJ and the Ministry of Finance highlights that the Yen weakness has become a political problem. Last week Japan had to intervene to prop up the yen for the first time since 1998. Of course, it's hard to time such shifts, but we expect the economy to remain resilient, which should increase inflation pressure that will precede a policy adjustment or, at the very least, a softening of the hawkish stance.
It's important to be cautious about being overly bearish on nearly every currency besides the US dollar. Though the balance of risks is still giving the US dollar a bid, the trade is increasingly becoming very crowded. At a moment's notice, international markets could see a material upside higher, bolstered by cheap valuations and even cheaper currencies.
Emerging Markets
We remain significantly underweight, near no weight, in emerging markets. US dollar strength is a real problem for many developing markets, as is a Chinese slowdown. Not to mention the additional political/social risks that arise with food shortages, high inflation and elevated commodity prices. Though emerging markets are now trading below pre-Covid levels, it’s hard to envision a scenario where the lead to the upside amid a global economic slowdown. When green shoots emerge, emerging markets could be a great investment. However, we continue to believe that now is not the time.
Fixed Income
Rather than being a diversifier, bonds this year have been a driver of lower returns. Rising rates over the year caused a tremendous amount of turmoil in the bond market. Looking ahead, uncertainty about the economy, inflation as well as future central bank policy are all big question marks. Within our models, we remain tilted with a lower duration and an overweight in credit.
Our current duration of 5 years is shorter than the FTSE TMX Universe duration of 7.5 years. We continue to have an eye to increasing duration as yields rise. In August, we mentioned that if rates got up to 4%, we'd take the opportunity to increase duration to the 6 range. Though US 10-year yields briefly hit 4%, it quickly retraced over 20bps in a matter of hours.
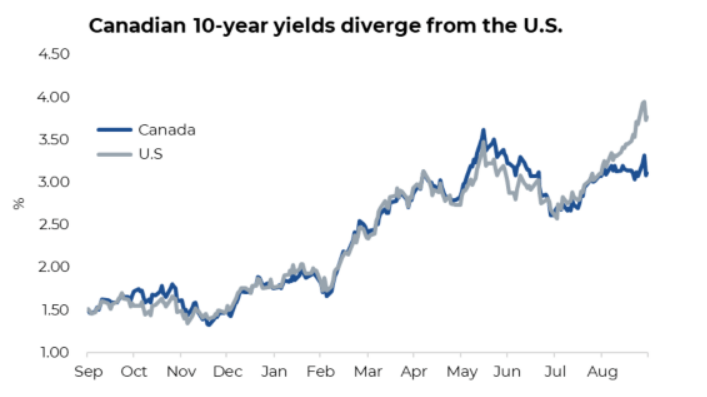
The divergence between Canada and US 10-year bond yields has also caught our attention.
Canadian yields are materially lower than they were in June and nowhere close to our 4% target. The spread currently stands at -67bps, a decline of
100bps from the beginning of the quarter. In the US, the latest Fed meeting came with a significant upward revision to the 'dots' and markets now expect a terminal rate of 4.5% by early 2023 vs. 4.25% previously. Though the BoC has had its own monster rate hikes, the terminal rate has not changed as much and is around 4.0% in early 2023. We continue to plan on increasing duration in tranches as our upper targets are hit, taking a more measured approach. Should a recession materialize in 2023, we expect longer-duration fixed income positions to perform better than shorter-duration bonds.
Credit
We remain overweight credit within the portfolio, preferring higher quality investment grade exposure. Defaults remain low, and rising credit spreads have increased the yield. Popular high-yield ETFs are yielding close to 6%, though we don’t believe the added level of risk heading into a potential recession is worth it. A slowing economy will put pressure on earnings and default risk. A lot of damage has already occurred in credit markets; we’re focusing on quality, preferring investment-grade exposure to high yield at this point. Though near-term risks remain, over a full cycle, the outlook for high-quality credit given current spreads is appealing despite the perceived risks.
With Japan and the U.K. as early examples, the tension between Central Banks and governments will undoubtedly increase in coming quarters. Fighting inflation is impossible without causing economic harm. For all the credit that central banks receive in moving markets, it’s important to remember that central banks may decide when to raise rates, but markets decide when to lower them. This shift can occur suddenly and without warning.
Currency Matters
The US dollar continues to steamroll every other currency. The pain has been most acute just this past week and is beginning to cause issues for economies around the world. A “reverse currency war” is breaking out amongst central banks as they struggle to keep pace with the surging greenback. So far, the strong dollar seems not to be a problem for the US administration, and the nearly historic central-bank-fueled move is unlikely to abate anytime soon. By some measures, such as purchasing power parity, the US dollar is overvalued. Still, the situation is summed up nicely by this 50-year quote by the then US Treasury Secretary John Connally, “the dollar is our currency, but it’s your problem.”
The pain of a rising dollar is typically most acute in emerging markets, but with the yen and British pound both down over 20% YTD, developed markets have been far from immune. The Canadian dollar remains stronger than most other major currencies year-to-date. The loonie has fallen -4.75% in September, almost double the fall in the Euro and nearly keeping pace with the pound. The swift move coincides with a sudden reversal in rate differentials. The spread between US and Canadian 2-year government bonds has reversed from -16bps to nearly 40bps just this month. The vanishing yield premium for Canadian paper has punished the loonie over the past few weeks. The dramatic fall brought the loonie below $0.73 USD and brought about an important question for investors – to hedge or not to hedge?
We’ve long preferred to leave our US dollar exposure unhedged, believing that the US dollar provides strong diversification benefits to Canadian investors. 2022 has been a great case study of the US dollar safe haven status, but it’s hard to deny that the US dollar is looking overbought. The one-year rate of change for the US dollar Index is nearly 20%, a level that historically implies a top or at least a period of consolidation. Should the loonie weaken a few more cents or even now, it may be the time to consider hedging US dollar exposure.
— Craig Basinger is the Chief Market Strategist at Purpose Investments
Source: Charts are sourced to Bloomberg L.P. and Purpose Investments Inc.
The contents of this publication were researched, written and produced by Purpose Investments Inc. and are used by Echelon Wealth Partners Inc. for information purposes only.
This report is authored by Craig Basinger, Chief Market Strategist, Purpose Investments Inc.
Disclaimers
Echelon Wealth Partners Inc.
The opinions expressed in this report are the opinions of the author and readers should not assume they reflect the opinions or recommendations of Echelon Wealth Partners Inc. or its affiliates. Assumptions, opinions and estimates constitute the author's judgment as of the date of this material and are subject to change without notice. We do not warrant the completeness or accuracy of this material, and it should not be relied upon as such. Before acting on any recommendation, you should consider whether it is suitable for your particular circumstances and, if necessary, seek professional advice. Past performance is not indicative of future results. The comments contained herein are general in nature and are not intended to be, nor should be construed to be, legal or tax advice to any particular individual. Accordingly, individuals should consult their own legal or tax advisors for advice with respect to the tax consequences to them.
Purpose Investments Inc.
Purpose Investments Inc. is a registered securities entity. Commissions, trailing commissions, management fees and expenses all may be associated with investment funds. Please read the prospectus before investing. If the securities are purchased or sold on a stock exchange, you may pay more or receive less than the current net asset value. Investment funds are not guaranteed, their values change frequently and past performance may not be repeated.
Forward Looking Statements
Forward-looking statements are based on current expectations, estimates, forecasts and projections based on beliefs and assumptions made by author. These statements involve risks and uncertainties and are not guarantees of future performance or results and no assurance can be given that these estimates and expectations will prove to have been correct, and actual outcomes and results may differ materially from what is expressed, implied or projected in such forward-looking statements. Assumptions, opinions and estimates constitute the author’s judgment as of the date of this material and are subject to change without notice. Neither Purpose Investments nor Echelon Partners warrant the completeness or accuracy of this material, and it should not be relied upon as such. Before acting on any recommendation, you should consider whether it is suitable for your particular circumstances and, if necessary, seek professional advice. Past performance is not indicative of future results. These estimates and expectations involve risks and uncertainties and are not guarantees of future performance or results and no assurance can be given that these estimates and expectations will prove to have been correct, and actual outcomes and results may differ materially from what is expressed, implied or projected in such forward-looking statements. Unless required by applicable law, it is not undertaken, and specifically disclaimed, that there is any intention or obligation to update or revise the forward-looking statements, whether as a result of new information, future events or otherwise. Before acting on any recommendation, you should consider whether it is suitable for your particular circumstances and, if necessary, seek professional
advice.
The particulars contained herein were obtained from sources which we believe are reliable, but are not guaranteed by us and may be incomplete. This is not an official publication or research report of either Echelon Partners or Purpose Investments, and this is not to be used as a solicitation in any jurisdiction.
This document is not for public distribution, is for informational purposes only, and is not being delivered to you in the context of an offering of any securities, nor is it a recommendation or solicitation to buy, hold or sell any security.