How do you build and manage multi-asset portfolios? This may sound like an innocuous question but given this is literally what all of us do in the finance industry, to one extent or another, it is kind of an important question. And we believe there is a shortage of thoughtful content on the topic. There is lots of content on what you should buy, and on topics like value, emerging markets, and high yield, etc., but not much on how to put it all together, how to manage it, how to conduct due diligence. We are like the auto industry that keeps talking about a single part of the car when it is how the car parts work together that gets you to where you are going.
The financial industry delivers/manages/advises on portfolios to help clients reach their long-term objectives. In this first instalment of Portfolio Construction Insights, we will share our thoughts and processes for generating a deeper understanding of a portfolio’s allocation and exposures. Plus, we’ll give our thoughts on exposure tilts given the current market environment.
In future installments, we will tackle many of the hurdles faced by practitioners, such as monitoring, due diligence, measuring the impact of changes, fees, active/passive, etc. The goal is to help provide readers with tools and ideas on how to improve their process.
Know what you own - Asset allocation down to exposures
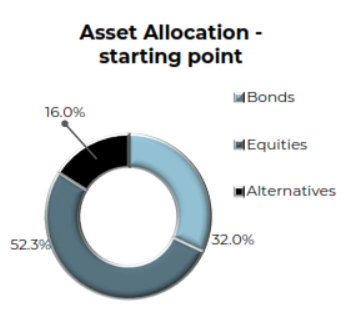
Constructing portfolios is both an art and a science. On the surface, it is creating a portfolio with an asset mix that is best designed for the client’s long-term risk and return objectives. Ideally, this asset mix can be tilted to incorporate the current macro environment, take advantage of opportunities, or try to reduce certain risks. Sadly, this is an oversimplification in a rather complex world.
One equity strategy may have very different underlying exposures compared with another, and simply bucketing into broad asset classes masks over many of the nuances that become very important in driving portfolio performance and volatility. In fact, many investments may cross over asset class lines in how they behave in different market environments. Some equities, such as utilities, health care, or consumer staples, may behave closer to some bond
allocations. While some bond allocations, such as high yield or preferreds, may behave more akin to equities. This is where the art of portfolio construction comes in.
In our portfolio analyzing and consulting services, we have found slicing a portfolio based on multiple levels of exposures can provide much deeper insights compared with surface-level asset allocations. With deeper insight, we can make better and more informed decisions. This is a quick run down of those lenses.
But where does the buck go next?
One reason valuations have likely come back down is that the outlook for earnings growth is starting to losepace. U.S. GDP is forecast to slow from 5.7% in 2021 to 3.7% this year and 2.5% next year. As a result, inflation is forecast to slow as well. Combine those with costs that are still likely rising, and you can imagine these record-high margins may be at serious risk of coming back down fast.
To give you an idea how fast this may decelerate, S&P operating earnings grew by over 60% in 2021. Sure, that was compared with 2020, but this growth is forecast to slow down to 9% in 2022. And that deceleration hits in Q1.
Investment Implications
This year has a lot of significant macro events going on. Going back to the office appears to be one; central banks changing direction on stimulus is another. However, slowing growth does not seem to garner much attention. While not negative growth, slowing growth along with stimulus removal makes for a more challenging market. Mark my words: it won’t be long before people start talking about a ‘hard or soft landing.’
Equities
If portfolio construction is akin to manufacturing an automobile, the equities are without a doubt the engine. Equity is the piece of the car that most often makes the portfolio go. And the engine has never promised a smoother ride. Equities captures such a wide swath of potential strategies and exposures, simply calling the allocation “equity” is almost a disservice. Small-cap Canadian venture capital companies are equities, as are trillion-dollar global technology giants and commodity producers located in emerging economies. Add to this list different active management strategies and various passive strategies, the variations are limitless.
Digging into equities we have found several additional lenses crucial for understanding the overall portfolios exposures and risks.
Geography
The starting point of any investment lens resides where that investment is positioned geographically. Typically, the main goal of the portfolio is to maximize return while minimizing risk, and what better way to do so than diversifying your allocation amongst a wide array of countries. Global economies do not always move in unison, allowing investors to reduce the correlation in their equity portfolio. Plus, the composition of markets is very different. This adds to diversification benefits, such as global pharmaceuticals, or consumer brands that are not available in such markets as Canada.
Going one step further, there are benefits to investing in developing economies. Investing in emerging markets allows for even more diversification potential. While there are many benefits to investing globally, it is not all sunshine and rainbows. From an overall level, keep an eye on how much currency risk and political risk there is amongst the nations you invest into.
The important takeaway is to be certain of what you are adding, if an investment says “global” in the name, ensure that is the case.
Many times, a “global” investment is simply 60% U.S. equities, which may not actually be global in the terms of your overall portfolio. On top of the country exposure, if risk is a concern, be certain of the developing nation exposure you would be adding to the portfolio.
Size, style & cyclicality
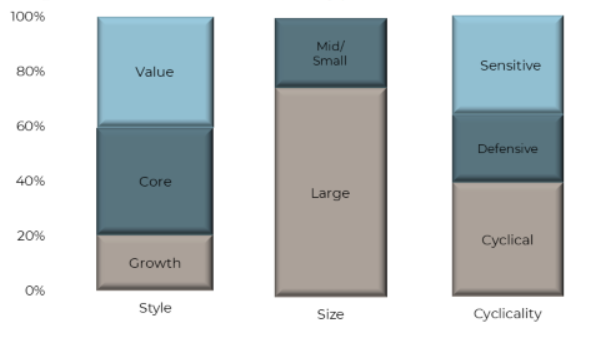
Moving on from geography and into the next investment lens, consider the style, size, and cyclicality of the portfolio. The style and size of a fund is typically fairly static, while the cyclicality can change given the managers outlook on economic conditions. For example, if a manager runs a large-cap value fund, that is what an investor is expecting out of the allocation to their portfolio. It is not very often that the manager will transition to buying up small-cap growth companies—it’s much more likely that a manager may believe we are in the trough of the business cycle and accordingly tilts towards more cyclical industries moving forward.
The goal is to align the portfolio tilts based on style, size, and cyclicality with the overall outlook view while keeping remaining diversified, as sometimes outlooks simply don’t work out as expected.
Monitoring these equity allocations of an overall portfolio is crucial to the success. While globalization has increased correlation amongst global equities, there are still benefits seen with diversifying internationally.
There have been strong divergences between style performance, especially as of late, which depending on how you are allocated can either contribute to the success or downfall of a model. Within a portfolio, every piece of the pie has their job and as Henry Ford once said, “nothing is particularly hard if you divide it into small jobs.”
Bonds (aka fixed income)
The early inventors of the automobile soon concluded that forward propulsion needs to be counteracted in order to make it safe. Thus, they invented the braking system. Similarly, we cannot overlook a portfolio’s fixed-income investments as they are necessary in avoiding unexpected obstacles. (Truth be told, we were torn with this sections automobile analogy since fixed-income instruments also help smooth out the ride like a suspension system, but we digress.)
Fixed-income instruments are typically used in a portfolio to reduce volatility and provide more consistent steady returns for clients. During times of market volatility, government bonds can offer significant protection to portfolios; however, with yields still near historic lows, the role of fixed-income investments has been a growing concern for asset allocators. It has become even harder to find the delicate balance between portfolio stability and the larger opportunity costs of diverting assets from potentially higher returns elsewhere.
From our perspective, the fixed-income portion of the portfolio consists of cash, corporate bonds, government bonds, securitized instruments as well as preferred shares. The proportion between these broad groups largely depends on the desired role of fixed income within a diversified portfolio. To further aid in the portfolio analysis approach, we focus on three key aspects to aid in the analysis.
Geography
Geographic exposure is straight forward. Our preferred approach focuses on just three broad buckets: Canada, the United States, and international, where we bucket everything else.
Perhaps more so than with equities, most Canadians have a large home country bias within their fixed-income allocations. While this makes sense from a liability matching standpoint, the potential pool of investments in Canada is rather limited especially in credit markets. Thus, it is important to look outside of our borders to some degree for a broader range of corporate bonds.
The common argument towards limiting foreign exposure within the fixed-income portion of the portfolio is to limit the potential volatility caused by swings in the currency markets. This risk is magnified in a low-rate environment, especially considering hedging costs can also be high relative to expected returns.
Credit
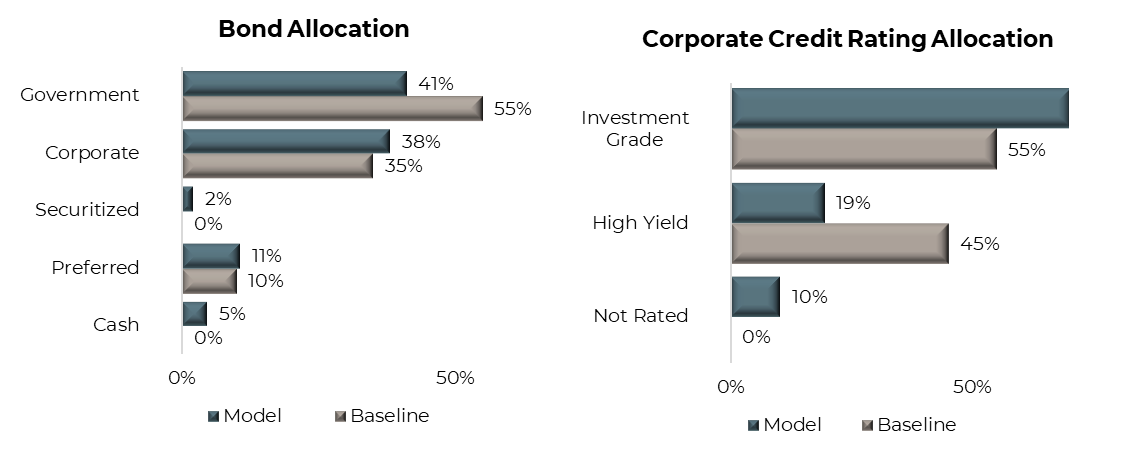
To compensate for lower returns, some advisors increase their fixed-income allocation with instruments that exhibit riskier equity like characteristics such as high-yield bonds. It is during market downturns; however, when fixed-income instruments serve to significantly reduce portfolio volatility and outperform riskier assets. As such, it is important to analyze the credit composition of individual fixed-income mandates to get a sense of the total exposure with a portfolio. It’s easy to get into the weeds when dissecting credit exposure, but from a portfolio approach we’re less interested in individual company exposure or specific credit ratings, but rather use larger buckets breaking them up into investment grade (AAA to BBB), high yield (BB or lower) or not rated.
By using this simple framework it’s quick and easy to see a portfolio’s overall exposure and perhaps if it is overly tilted towards credit. In this environment, investors unwilling to take on any credit risk nearly guarantees a low-return outcome. However, tilting too far into preferred shares or high-yield bonds offers more attractive yields but exposes clients to a much higher drawdown risk and a higher correlation to equities.
Duration
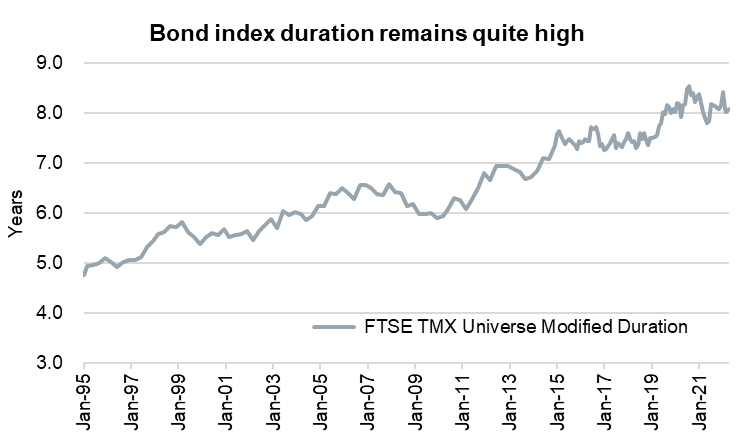
Bond market benchmarks themselves have changed overtime as you can see in the chart below. Over the past 20 years, yields have falling considerably but the duration, a measure of the sensitivity to interest rates has increased from a little over five years to over eight years. In other words, broad index exposure now takes on 50% more interest rate risk than 20 years ago, but with only one third of the yield.
Determining the appropriate overall duration of a portfolio largely depends on the outlook for interest rates. For instance, in a rising rate environment, a shorter duration is more appropriate to minimize interest rate risk. Typically, portfolios are compared with an appropriate baseline duration to determine the extent of rate exposure embedded withing the portfolio.
Advisors have a wide array of available investment options to construct a diversified fixed portfolio. The available options have grown considerably over the past few years with a wide array of new ETFs, private debt funds, and liquid alternatives geared toward the credit space.
Besides all the products available, using individual bonds in a laddered strategy, for instance, can also be an effective and highly cost-effective option. Large tilts within any of these key exposures should follow a wellthought-out strategic rationale with a clear understanding of what exactly the exposures want to achieve. The tricky end goal is to combine investments across the fixed-income spectrum to find balance between these three factors.
Alternatives
The definition of alternative strategies has changed over time. Years ago, if it was OM (offering memorandum instead of full prospectus), it was likely an alternative. Today, as the rules have changed there are alternative strategies in prospectus offered funds and ETFs. It really comes down to the underlying
strategy.
For portfolio construction, we view alternative strategies as those that offer a demonstrable different risk and/or return profile compared with long-only asset classes such as equities and bonds. The variety of strategies in the alternative asset class are also diverse. As a result, we categorize strategies into four purpose based cohorts depending on how we expect it to help the overall portfolio:
1. Diversifiers – reduce equity market risk for the portfolio
2. Credit / Income – reduce fixed-income risk and/or enhance cash flow
3. Growth – enhance the return of the portfolio
4. Real Assets – help protect portfolio purchasing power against inflation
These sub-classifications for alternatives are a bit more art than science. For instance, gold exposure is clearly a real asset but at times can be a diversifier. Many income strategies can offer some diversification benefits unless there is a credit event. Let’s just say the sub-categories are a loose fit. The goal of breaking down alternatives into these buckets is to help ensure the holdings or positions are diversified and pointed at the desired objective.
Current thoughts
If you read any amount of content opining on the markets (our content included), you have likely come across reports favouring an exposure: for example, value over growth. Does that mean you should only buy strategies with value in their name? Are those actually value and should there be zero growth exposure?
This is the critical phase where views on the market meet the equally important requirement of a well diversified portfolio. In the following section, we will share our views on the markets (abbreviated) and what that means for a multi-asset portfolio. To keep it manageable, we will be focusing on a middle-of-the-road, balanced objective profile.
Correction & the market cycle
The start of 2022 has clearly been rocky. At first it appeared more of a style rotation away from growth names, combined with rising yields, inflation, and a pending pivot by central bankers. Then war broke out. This put global equities into a correction.
There is a kind of simple rule when it comes to correction – if there is no pending recession, corrections are buying opportunities. If a recession is on the horizon, they are NOT buying opportunities.
The hard part is knowing if a recession is coming, which brings us to our Market Cycle framework. This multidisciplined approach combines economy, rates, and fundamental indicators that help paint a picture on the health of the cycle. The good news is that the cycle appears healthy.
This would normally have us a bit more excited to put cash to work in this pullback. But since it has been very narrowly focused on the growth factor, we
have not jumped in. For instance, the TSX is down about 2% from its high—not sure that is a bargain.
Nonetheless, the healthy market cycle indicator has us with a slight overweight in equities. Within this overweight is a decent tilt towards Canadian equities and minor tilt for international. These are more value-heavy markets, which results in style tilt away from growth. We are also underweight U.S. equities on valuation, style, and concentration issues.
Fixed income is an underweight as our current view is yields have a bit more to rise and spreads are compressed (albeit starting to look more interesting of late). Within this asset class, our duration remains low, and we are tilted more towards credit. We are also holding elevated cash.
Alternatives, which has a slight overweight, is mainly focused on diversifiers and real assets.
For diversifiers, given how far equity markets have advanced, up over 30% relative to pre-pandemic levels, we are increasingly concerned 2022 may prove to be a year with multiple corrections. Adding to the uncertainty is the pending pivot in central bank policy as a global tightening cycle appears to be getting underway. Complicating matters is higher inflation putting upward pressure on bond yields, as finding quality defensive diversifiers in traditional asset classes has become challenging.
While we do not believe runaway inflation is on the horizon, inflation risk is elevated. Headline consumer price index (CPI) has remained at decade highs because of supply bottlenecks and robust demand, especially for durable goods. While this should come back down in 2022, longer-term inflation expectations are creeping higher. Wage pressure is mounting, and the longer CPI remains high, the more behaviours begin to change. A diversified approach to real assets helps protect purchasing power should inflation remain elevated for an extended period.
Up next
We hope this glimpse into an approach for diving deeper into a portfolio has been beneficial. While it is extra work, it is time well spent. In the coming instalments, we will continue to tackle issues and provide solutions for practitioners, whether they be managing a disciplined model or an individual investor managing a single portfolio.
— Craig Basinger is the Chief Market Strategist at Purpose Investments
— Derek Benedet is a Portfolio Manager at Purpose Investments
— Brett Gustafson is a Portfolio Analyst at Purpose Investments
Source: Charts are sourced to Bloomberg L.P. and Purpose Investments Inc.
The contents of this publication were researched, written and produced by Purpose Investments Inc. and are used by Echelon Wealth Partners Inc. for
information purposes only.
This report is authored by Craig Basinger, Greg Taylor and Derek Benedet Purpose Investments Inc.
The contents of this publication were researched, written and produced by Purpose Investments Inc. and are used herein under a non-exclusive license by Echelon Wealth Partners Inc. (“Echelon”) for information purposes only. The statements and statistics contained herein are based on material believed to be reliable but there is no guarantee they are accurate or complete. Particular investments or trading strategies should be evaluated relative to each individual's objectives in consultation with their Echelon representative.
Echelon Wealth Partners Ltd.
The opinions expressed in this report are the opinions of the author and readers should not assume they reflect the opinions or recommendations of Echelon Wealth Partners Ltd. or its affiliates. Assumptions, opinions and estimates constitute the author's judgment as of the date of this material and are subject to change without notice. We do not warrant the completeness or accuracy of this material, and it should not be relied upon as such. Before acting on any recommendation, you should consider whether it is suitable for your particular circumstances and, if necessary, seek professional advice. Past performance is not indicative of future results. The comments contained herein are general in nature and are not intended to be, nor should be construed to be, legal or tax advice to any particular individual. Accordingly, individuals should consult their own legal or tax advisors for advice with respect to the tax consequences to them.
Purpose Investments Inc.
Purpose Investments Inc. is a registered securities entity. Commissions, trailing commissions, management fees and expenses all may be associated with investment funds. Please read the prospectus before investing. If the securities are purchased or sold on a stock exchange, you may pay more or receive less than the current net asset value. Investment funds are not guaranteed, their values change frequently and past performance may not be repeated.
Forward Looking Statements
Forward-looking statements are based on current expectations, estimates, forecasts and projections based on beliefs and assumptions made by author. These statements involve risks and uncertainties and are not guarantees of future performance or results and no assurance can be given that these estimates and expectations will prove to have been correct, and actual outcomes and results may differ materially from what is expressed, implied or projected in such forward-looking statements. Assumptions, opinions and estimates constitute the author’s judgment as of the date of this material and are subject to change without notice. Neither Purpose Investments nor Echelon Partners warrant the completeness or accuracy of this material, and it should not be relied upon as such. Before acting on any recommendation, you should consider whether it is suitable for your particular circumstances and, if necessary, seek professional advice. Past performance is not indicative of future results. These estimates and expectations involve risks and uncertainties and are not guarantees of future performance or results and no assurance can be given that these estimates and expectations will prove to have been correct, and actual outcomes and results may differ materially from what is expressed, implied or projected in such forward-looking statements. Unless required by applicable law, it is not undertaken, and specifically disclaimed, that there is any intention or obligation to update or revise the forward-looking statements, whether as a result of new information, future events or otherwise.
Before acting on any recommendation, you should consider whether it is suitable for your particular circumstances and, if necessary, seek professional advice.
The particulars contained herein were obtained from sources which we believe are reliable, but are not guaranteed by us and may be incomplete. This is not an official publication or research report of either Echelon Partners or Purpose Investments, and this is not to be used as a solicitation in any jurisdiction.
This document is not for public distribution, is for informational purposes only, and is not being delivered to you in the context of an offering of any securities, nor is it a recommendation or solicitation to buy, hold or sell any security.