The markets, which had been gently inching towards correction territory,
got pushed over the threshold on the news of Russia invading Ukraine. The obvious reaction to this unfortunate news hit the markets overnight. It was a true risk-off environment with government bonds moving higher, the U.S. dollar rising along with other “safe-haven” currencies, gold up 3%, and of course equities lower. The Bloomberg World index, which covers 85% of all equities, was pushed below the 10% correction threshold for the first time since the pandemic-induced market drop.
But hold on, as the day progressed, the selloff faded, and markets recovered, once again reminding investors that even if you get the macro call right (i.e.,
Russia invades), equally important is correctly guessing how the market will react. You must get both parts right to turn a profit in the short term—an elusive goal and perhaps why the career length of day traders tends to be short.
Corrections are normal
Our memories suffer from a few biases—notably that recent events tend to carry a greater influence on our worldview. For those technicians, think of it like this: instead of our memories being a simple moving average, they’re more like an exponential moving average. Or for normal humans, think of how you remember the last month of your life with greater detail than what happened in the same month a year ago. This greater emphasis on recent history has us focusing more on the last 20 months, which from a market perspective included limited pullbacks, low volatility, and outsized gains, making this recent bout of weakness likely seem harsher. But the fact is: corrections are normal market events.
Over the past 70 years, there have been roughly 40 corrections for the S&P 500. Well, that is simple math: a correction every 1.75 years.
Since we hadn’t experienced a correction since the drop in February and March of 2020, almost two years ago, the markets have actually been doing remarkable well. Of course, 1.75 is an average, so don’t go marking your calendar for the next correction in November 2023. Perhaps the markets were simply due.
So, is this a buying opportunity or harbinger?
There is a simple rule for corrections – if there isn’t a recession around the corner, they are all buying opportunities. If there is a recession coming, all bets are off. This naturally leads to the next question:
is there a recession on the horizon? The good news here is a very confident “not likely.”
The global economy is growing at about a 4-5% pace, the U.S. economy even faster. This Russia mess may slow create a bit of a bump but with such economic momentum, recession risk is very low. The chart below shows a couple Fed recession probabilities that are very low. Add to this our market cycle framework that incorporates over 30 indicators, we concur with the Fed banks.
Load up?
Not so fast. While some of the correction buy signals have flashed green, others have not. One of our historical favourites has been the American Association of Individual Investor sentiment survey. When investors are bearish, this had signalled market bottoms. We find using a four-week average sentiment of bulls minus bears provides a more reliable signal. Over the past 20 years, when at -20, the forward return for the S&P 500 has been rather strong, with the exception of 2008, which again leads us back to whether there is a recession looming or not.
However, survey data has been rather odd over the past few quarters. For this survey, investors turned pretty bearish even before the market weakness set in. That is odd. Consumer confidence survey data has been particularly weak as well, which doesn’t add up with employment, wage, and wealth trends. Still, this is a compelling data point to be bullish from here.
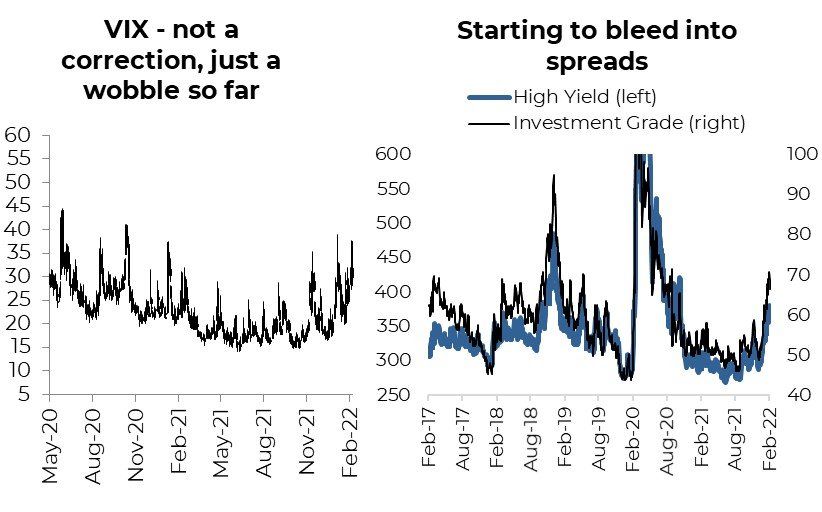
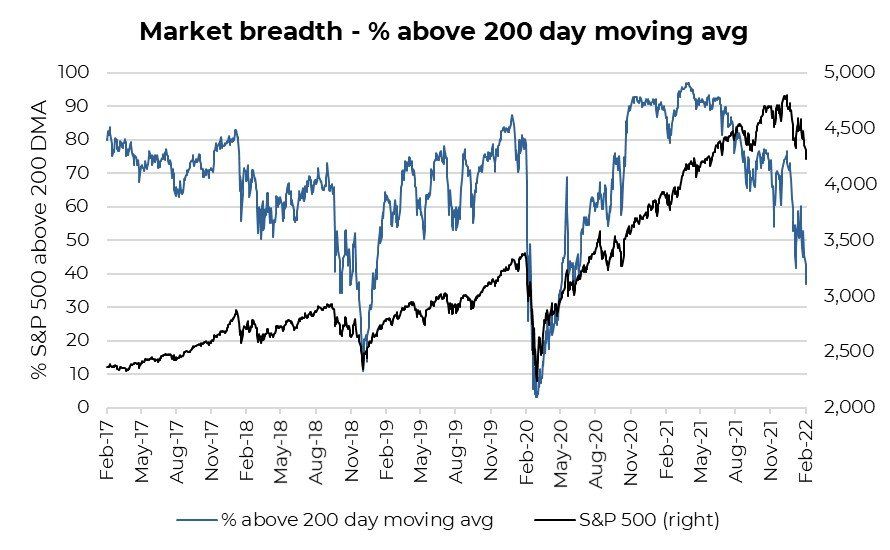
Less compelling, the VIX moved higher but never really spiked. Spreads have moved higher but not materially, compared with 2018. The bond/equity correlation as well, which during risk-off markets tends to become strongly negative, has only marginally moved in that direction. Market breadth has fallen but not to normal correction trough levels.
A correction does not require all these signals before a bottom is put in, but it would be more reassuring if a few more of them were giving the buy signal.
Then again, actively buying during periods of market weakness is never easy and often feels wrong.
Investment Implications
The market weakness so far this year has been very concentrated, in the growth and size factors, and has only spread partially to the rest of the market. This is evident in the S&P 500 growth index being down 14% this year, compared with the S&P 500 value index being down less than 4%, or the value-tilted TSX being down only 1.5%. International markets are down more, with a market’s proximity to Ukraine acting as a current factor.
Markets enjoyed a few years of performance well above trend but have a lot to digest this year. Central banks are pivoting the stimulus machine. Inflation remains a risk. And behaviors are changing: going back from durable goods to services (this it is starting to show up in select company earnings as well).
This is a correction but there just don’t seem to be enough signals to jump in with both feet. Maybe just a toe or two in some parts of the market.
Source: Charts are sourced to Bloomberg L.P. and Purpose Investments Inc.
The contents of this publication were researched, written and produced by Purpose Investments Inc. and are used by Echelon Wealth Partners Inc. for information purposes only.
This report is authored by Craig Basinger, Chief Market Strategist, Purpose Investments Inc.
The contents of this publication were researched, written and produced by Purpose Investments Inc. and are used herein under a non-exclusive license by Echelon Wealth Partners Inc. (“Echelon”) for information purposes only. The statements and statistics contained herein are based on material believed to be reliable but there is no guarantee they are accurate or complete. Particular investments or trading strategies should be evaluated relative to each individual's objectives in consultation with their Echelon representative.
Echelon Wealth Partners Ltd.
The opinions expressed in this report are the opinions of the author and readers should not assume they reflect the opinions or recommendations of Echelon Wealth Partners Ltd. or its affiliates. Assumptions, opinions and estimates constitute the author's judgment as of the date of this material and are subject to change without notice. We do not warrant the completeness or accuracy of this material, and it should not be relied upon as such. Before acting on any recommendation, you should consider whether it is suitable for your particular circumstances and, if necessary, seek professional advice. Past performance is not indicative of future results. The comments contained herein are general in nature and are not intended to be, nor should be construed to be, legal or tax advice to any particular individual. Accordingly, individuals should consult their own legal or tax advisors for advice with respect to the tax consequences to them.
Purpose Investments Inc.
Purpose Investments Inc. is a registered securities entity. Commissions, trailing commissions, management fees and expenses all may be associated with investment funds. Please read the prospectus before investing. If the securities are purchased or sold on a stock exchange, you may pay more or receive less than the current net asset value. Investment funds are not guaranteed, their values change frequently and past performance may not be repeated.
Forward Looking Statements
Forward-looking statements are based on current expectations, estimates, forecasts and projections based on beliefs and assumptions made by author. These statements involve risks and uncertainties and are not guarantees of future performance or results and no assurance can be given that these estimates and expectations will prove to have been correct, and actual outcomes and results may differ materially from what is expressed, implied or projected in such forward-looking statements. Assumptions, opinions and estimates constitute the author’s judgment as of the date of this material and are subject to change without notice. Neither Purpose Investments nor Echelon Partners warrant the completeness or accuracy of this material, and it should not be relied upon as such. Before acting on any recommendation, you should consider whether it is suitable for your particular circumstances and, if necessary, seek professional advice. Past performance is not indicative of future results. These estimates and expectations involve risks and uncertainties and are not guarantees of future performance or results and no assurance can be given that these estimates and expectations will prove to have been correct, and actual outcomes and results may differ materially from what is expressed, implied or projected in such forward-looking statements. Unless required by applicable law, it is not undertaken, and specifically disclaimed, that there is any intention or obligation to update or revise the forward-looking statements, whether as a result of new information, future events or otherwise.
Before acting on any recommendation, you should consider whether it is suitable for your particular circumstances and, if necessary, seek professional advice.
The particulars contained herein were obtained from sources which we believe are reliable, but are not guaranteed by us and may be incomplete. This is not an official publication or research report of either Echelon Partners or Purpose Investments, and this is not to be used as a solicitation in any jurisdiction.
This document is not for public distribution, is for informational purposes only, and is not being delivered to you in the context of an offering of any securities, nor is it a recommendation or solicitation to buy, hold or sell any security.