After posting its third consecutive quarter of declines, the stock market has managed to stay slightly positive so far in October—despite bond yields continuing to climb. Both Canadian and U.S. 10-year bond yields posted new highs this past week with U.S. 10-years rising to 4.25%. With yields rising at a frenzied pace, market volatility continues to be a grisly backdrop for both the stock and bond market.
Bad news for the bond market is rarely a good sign for stocks. Though we saw a fresh low on October 13th, a so-far so-good earnings season has eased some of the fear. The stunning reversal on the 13th has some arguing that we’re nearing a point of capitulation.
In this Weekly Insights, we take a look at fund flows to see if they confirm any signs of a market bottom.
Markets were oversold at the end of September, where more than 40% of constituents in the S&P 500 had an RSI below 30, which may indicate a technical bottoming. These types of oversold markets often lead to some near- term consolidation. Any bear market rally or seasonal surge will at some point have to come to terms with the rising cost of capital and compete with an emerging ‘new’ asset class.
What is this new asset class that is competing with stocks? It’s not private debt, or a new digital currency – it’s plain old cash. A shelter from the volatility, with an attractive yield as well.
TINA (there is no alternative) left and packed her bags after TARA (there are reasonable alternatives) moved to town.
Cash Is Popular Again
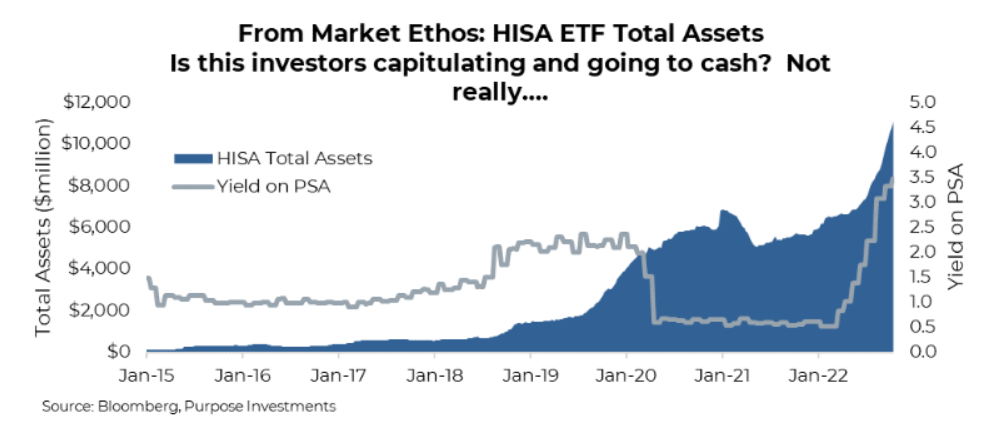
From October 10th to the 14th, the
Purpose High Interest Savings ETF (PSA) had the most inflows out of any Canadian listed ETF, adding $140 million. Rounding out the top ten were a number of other—likely inferior—money market and high-interest savings funds (please note our view is clearly biased). Cash pays and is gaining popularity, as you can see in the tremendous growth in the chart below.
The contents of this publication were researched, written and produced by Purpose Investments Inc. and are used herein under a non- exclusive license by Echelon Wealth Partners Inc. (“Echelon”) for information purposes only. The statements and statistics contained herein are based on material believed to be reliable but there is no guarantee they are accurate or complete. Particular investments or trading strategies should be evaluated relative to each individual's objectives in consultation with their Echelon representative.
It’s not exactly easy to see where these flows are coming from, or if in isolation these moves are a sign of capitulation.
Fleeing to cash and out of equities would be classic capitulation behavior, which becomes evident in many bear markets near the bottom. The outflows often continue well into the next bull cycle, but that is another topic. However, it’s impossible to say that the move into cash products is a sign of de-risking or simply investors deciding that with liquid cash alternatives yielding so much, they are putting to work idle cash that had been earning a pittance in bank accounts. It is also a potential destination for proceeds from tax loss selling fixed-income securities.
The surge into high interest savings account (HISA) products is noteworthy, but their existence is simply too short to draw any conclusions as to whether or not it’s a sign of investor capitulation and potentially a market bottom. To get a better picture of fund flows, the chart below is from the U.S. market and is the percentage of fund assets in money market funds. We have to point out in the 2000 and 2008 bear markets, there were much fewer cash-like alternatives as there are today, which explains the relatively low weighting in money market funds. Still, the chart has value as
in each bear there is a spike of some sort for money market assets. So far in this bear we have seen more of a gentle rise. Maybe there won’t be a spike given flows into so many cash vehicles from HISA, GICs, CDs, etc.
Stocks and Bonds
Looking back over the past six years with data from ICI Global, we can get a look at the total flow entering or leaving equity markets. Fund & ETF flows are a proxy for what individual investors are doing in the market. From the chart below, outflows have been consistently negative over most of the year; however, recent outflows have not even eclipsed what we saw in the spring or come even close to 2020.
The lack of any major spike in outflows coinciding with the most recent low in the S&P 500 does not confirm a capitulation low.
Looking just at ETFs over the past couple of months, flows are still surprisingly positive. It’s worth keeping in mind that the ETF space as a whole continues to grow, benefitting from the long structural shift towards ETFs over funds and single securities. This growth as a percentage of AUM would be considered subpar in terms of expected flows for most asset managers.
Overall, buying behaviour for U.S.-listed equity ETFs remains broad based, with a large cap tilt.
Many sector ETFs are getting hit, but interestingly it’s not because investors are dialing back on risk. The chart below shows that following a spike mid-September, flows into defensive sectors have turned negative. Flows into cyclical sectors turned positive in October, driven by strong flows into the Energy sector. Meanwhile, outflows in Discretionary and Industrials have tempered the cyclical rebound. Over the past two months, all sectoral ETFs saw outflows except for Energy led by Financials and Communication Services. Sector flows have been far from uniform.
It's hard to see any clear defensive shift from a sector perspective, though it’s clearly depicted in bond flows. Government bonds remain in high demand.
Inflation-protection securities are no longer seeing strong demand, with outflows in that segment nearly as bad as emerging market debt.
Corporate bond funds continue to face outflows as investors seek to limit credit risk.
Portfolio Considerations
Fear of losing and fear of missing out are at two opposite ends of a spectrum. Based on where capital is flowing, the fear of losing is still bigger than investors fear of missing out (on the recovery). And while one could point to HISA and other flows into cash products as signs of final capitulation, we remain unconvinced. A year ago, if you had $10k in your bank account, you could have made $50/yr by moving it into a HISA or other paying instruments. It was hardly worth the bother. Today, you will make $350—okay, even the lazy may act with that reward. We would also like to point out there doesn’t have to be a capitulation event: all cycles are different.
This bear market is now over 10 months old, it is oversold, sentiment is very negative, and valuations have become more appealing.
Still, inflation has not started to improve, and there is no shortage of recession talk. Bear markets have bear market rallies, and the last bear market rally will prove to be the start of the next bull. We will only know which is which well after the fact.
From a flow perspective, we’re not seeing any clear signs of capitulation, or complete surrender to this bear. Simply put, there is no white flag.
— Derek Benedet is a Portfolio Manager at Purpose Investments
— Craig Basinger is the Chief Market Strategist at Purpose Investments
The contents of this publication were researched, written and produced by Purpose Investments Inc. and are used by Echelon Wealth Partners Inc. for information purposes only.
This report is authored by Craig Basinger, Chief Market Strategist, Purpose Investments Inc.
Disclaimers
Echelon Wealth Partners Inc.
The opinions expressed in this report are the opinions of the author and readers should not assume they reflect the opinions or recommendations of Echelon Wealth Partners Inc. or its affiliates. Assumptions, opinions and estimates constitute the author's judgment as of the date of this material and are subject to change without notice. We do not warrant the completeness or accuracy of this material, and it should not be relied upon as such. Before acting on any recommendation, you should consider whether it is suitable for your particular circumstances and, if necessary, seek professional advice. Past performance is not indicative of future results. The comments contained herein are general in nature and are not intended to be, nor should be construed to be, legal or tax advice to any particular individual. Accordingly, individuals should consult their own legal or tax advisors for advice with respect to the tax consequences to them.
Purpose Investments Inc.
Purpose Investments Inc. is a registered securities entity. Commissions, trailing commissions, management fees and expenses all may be associated with investment funds. Please read the prospectus before investing. If the securities are purchased or sold on a stock exchange, you may pay more or receive less than the current net asset value. Investment funds are not guaranteed, their values change frequently and past performance may not be repeated.
Forward Looking Statements
Forward-looking statements are based on current expectations, estimates, forecasts and projections based on beliefs and assumptions made by author. These statements involve risks and uncertainties and are not guarantees of future performance or results and no assurance can be given that these estimates and expectations will prove to have been correct, and actual outcomes and results may differ materially from what is expressed, implied or projected in such forward-looking statements. Assumptions, opinions and estimates constitute the author’s judgment as of the date of this material and are subject to change without notice. Neither Purpose Investments nor Echelon Partners warrant the completeness or accuracy of this material, and it should not be relied upon as such. Before acting on any recommendation, you should consider whether it is suitable for your particular circumstances and, if necessary, seek professional advice. Past performance is not indicative of future results. These estimates and expectations involve risks and uncertainties and are not guarantees of future performance or results and no assurance can be given that these estimates and expectations will prove to have been correct, and actual outcomes and results may differ materially from what is expressed, implied or projected in such forward-looking statements. Unless required by applicable law, it is not undertaken, and specifically disclaimed, that there is any intention or obligation to update or revise the forward-looking statements, whether as a result of new information, future events or otherwise. Before acting on any recommendation, you should consider whether it is suitable for your particular circumstances and, if necessary, seek professional
advice.
The particulars contained herein were obtained from sources which we believe are reliable, but are not guaranteed by us and may be incomplete. This is not an official publication or research report of either Echelon Partners or Purpose Investments, and this is not to be used as a solicitation in any jurisdiction.
This document is not for public distribution, is for informational purposes only, and is not being delivered to you in the context of an offering of any securities, nor is it a recommendation or solicitation to buy, hold or sell any security.