Last Wednesday, if you somehow had a premonition that U. S. Consumer Prices (CPI)
were
NOT going show signs of cooling but instead surprise to the upside to bring core CPI to
its highest annual pace in four decades, you would have expected markets to tumble on Thursday.
And you would have been right until about 11am when markets didn’t just get back to break even but then went on to post very strong gains. The S&P 500 intraday range from the lows in the morning to the highs at the close was about 5%. The biggest angst for the markets this year has surely been the path and stickiness of inflation, so it befuddles the mind to make sense of Thursday’s market reaction, even with Friday giving back some of the gains. If you can characterize bear markets, moving from repricing or multiple contraction to more emotional-driven behaviour is a natural progression. As we see money flowing very quickly into cash proxies and product, it is clear the apathic patience of the first phase has given way to classic run-and-hide behaviour.
New Title
Was it the yeomen work of economists and analysts, pouring through the details of the CPI data to uncover a good news story? Sure, doesn’t look like it. We wouldn’t call the inflation report terrible, but it certainly was not good. There were some signs of prices falling in a number of goods categories—but used car prices rose, defying the trend in wholesale prices that typically leads this category. Airline prices, which had been falling, turned back up a bit. Shelter prices rose, although we are unsure if this category will illicit a market response, given it follows home prices with a multi-quarter lag—since home prices are rolling over, this should follow at some point. Services inflation was high as wages are coming through. Overall, it was not a good CPI report,
so why such a happy market on the data release day?
The contents of this publication were researched, written and produced by Purpose Investments Inc. and are used herein under a non- exclusive license by Echelon Wealth Partners Inc. (“Echelon”) for information purposes only. The statements and statistics contained herein are based on material believed to be reliable but there is no guarantee they are accurate or complete. Particular investments or trading strategies should be evaluated relative to each individual's objectives in consultation with their Echelon representative.
I’m gonna let you in a bit of a secret – nobody really knows why the market moves up or down on a given day.
Sure, we or any market opener can slap a narrative on it that sounds logical, plausible…even convincing. For example, it was a short covering gamma squeeze. But the truth is the market is composed of millions of participants with different characteristics, different reaction functions to various news or data, and different risk appetites. And some of these millions of participants meet at a price that one is willing to sell, and the other buy a given security. Oh, and those participants mood changes from day to day. For instance, there is a small relationship between the S&P daily performance and the weather in NY.
Okay, just checked the weather network and this week looks like a sunny one, which is good news.
Day-to-day market moves are pretty random at the best of times and when the market is in the 10th month of a bear, the random moves are magnified substantially. The VIX index, which measures the implied volatility in S&P 500 index options, still remains tame compared with past periods of market stress with many waiting for a reading above 40 as some potential sign of capitulation (like that can be measured). However, there is no denying the uncertainty in this market.
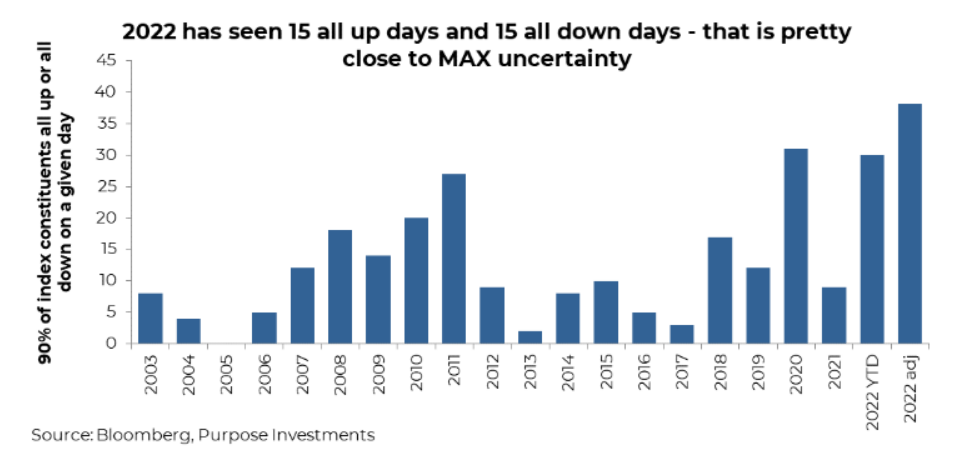
One metric we have used over the years is measuring the number of all up or all down days for the S&P 500. An up day is when 90% of the index members rise on a given day and conversely a down day is when 90% fall.
2022 has had 30 such trading days, all up or all down. This is on pace to be the most all or none days in at least 20 years. Also worth noting, ten of those 30 days have occurred in the last month alone. The market appears to be at max uncertainty, which could be good…or bad.
Let’s look past the daily gyrations in the market for a moment to gain some perspective. This is what we know, and if we know it, so does the market:
- Inflation, not surprisingly, is proving to be stickier and has so far shown little signs of coming back down from elevated levels. That being said, most forward-looking indicators that warned of the rise of inflation to current levels are showing signs of rolling over or less inflation ahead. Remember, inflation is very slow to react so this may lead to more waiting than the market is comfortable with.
- Recession risk is high and rising.
China’s growth has slowed, Europe may already be in a recession due to energy and slowing global trade. The Canadian economy is doing well but starting to slow. The U.S. economy is doing better than most but is also starting to show signs of slowing. A recession, which is bad, would also alleviate inflation pressures, which is good. Would the good be a bigger positive for markets than the bad? Depends on the recession or how much global growth slows. One good aspect is various economies are already at different stages of slowing, a much better backdrop than 2008 when all economies slowed simultaneously. By the time slowing growth potentially takes hold in North America, other economies may already be on the mend. This desynchronized slowing is kind of a good thing.
- Earnings estimates are too high, or so says just about everybody. This is widely known and at least partially priced in. The S&P 500 has seen its forward price-to-earnings multiple drops from 21x to 15x. The TSX is trading at a paltry 11x, Europe 10x, and Emerging Markets 10x. These valuations, roughly at the lows of 2020, certainly incorporate potential softness in earnings.
- Markets have priced in all or much of this news, even if it does sound all doom and gloom. 10- year bond yields in the U. S. have risen from 0. 75% to 4. 00%. Futures are pricing in a peak Fed Funds rate of 4.9% in Q1 of 2023, nearly another 175bps of hikes. The S&P 500 is down -25%, TSX -17%, Europe -23% (-28% in CAD), Japan down -9% (-23% in CAD), and Emerging Markets -34% (-27% in CAD).
These are all ‘known knowns’ and shouldn’t elicit too much fear about the future. It’s surprises, either good or bad, that will move markets going forward. Could the already sticky inflation prove even stickier than the market expects? Yes, but could also start to roll over. Either way, markets will move either down
or up, respectively. A mild global recession would likely not be bad for markets, but if more severe, it would be, and if milder, it would be a positive surprise. Earnings estimates could fall but companies have been benefitting from inflation as there are positive surprises too.
Portfolio Construction
We would agree the path forward is very uncertain. And the magnitude of daily gyrations clearly supports this view of HIGH UNCERTAINTY. We don’t know when the bottom of the bear will be put in: history and experience tell us bears always feel like they last a long time (time flies during bulls and drags during bears). Maybe it will be when inflation, the root cause of this bear, begins to improve. Or maybe it will just end and a month afterwards a narrative will gain traction to explain why it ended when it did.
We know lower prices for equities and bonds means we are closer to the bottom, and future risk declines. A good way to think about it is the S&P 500 at 4,800 in January was much riskier than at 3,600 today. We remain neutral with our equity allocation—doesn’t feel right to add just yet on the hope the surprises turn positive but equally doesn’t feel right piling into cash.
The daily gyrations of this magnitude are often seen at key turning points, in either direction. Let’s hope the weather forecast remains sunny for NY, as any little bit will help.
— Craig Basinger is the Chief Market Strategist at Purpose Investments
The contents of this publication were researched, written and produced by Purpose Investments Inc. and are used by Echelon Wealth Partners Inc. for information purposes only.
This report is authored by Craig Basinger, Chief Market Strategist, Purpose Investments Inc.
Disclaimers
Echelon Wealth Partners Inc.
The opinions expressed in this report are the opinions of the author and readers should not assume they reflect the opinions or recommendations of Echelon Wealth Partners Inc. or its affiliates. Assumptions, opinions and estimates constitute the author's judgment as of the date of this material and are subject to change without notice. We do not warrant the completeness or accuracy of this material, and it should not be relied upon as such. Before acting on any recommendation, you should consider whether it is suitable for your particular circumstances and, if necessary, seek professional advice. Past performance is not indicative of future results. The comments contained herein are general in nature and are not intended to be, nor should be construed to be, legal or tax advice to any particular individual. Accordingly, individuals should consult their own legal or tax advisors for advice with respect to the tax consequences to them.
Purpose Investments Inc.
Purpose Investments Inc. is a registered securities entity. Commissions, trailing commissions, management fees and expenses all may be associated with investment funds. Please read the prospectus before investing. If the securities are purchased or sold on a stock exchange, you may pay more or receive less than the current net asset value. Investment funds are not guaranteed, their values change frequently and past performance may not be repeated.
Forward Looking Statements
Forward-looking statements are based on current expectations, estimates, forecasts and projections based on beliefs and assumptions made by author. These statements involve risks and uncertainties and are not guarantees of future performance or results and no assurance can be given that these estimates and expectations will prove to have been correct, and actual outcomes and results may differ materially from what is expressed, implied or projected in such forward-looking statements. Assumptions, opinions and estimates constitute the author’s judgment as of the date of this material and are subject to change without notice. Neither Purpose Investments nor Echelon Partners warrant the completeness or accuracy of this material, and it should not be relied upon as such. Before acting on any recommendation, you should consider whether it is suitable for your particular circumstances and, if necessary, seek professional advice. Past performance is not indicative of future results. These estimates and expectations involve risks and uncertainties and are not guarantees of future performance or results and no assurance can be given that these estimates and expectations will prove to have been correct, and actual outcomes and results may differ materially from what is expressed, implied or projected in such forward-looking statements. Unless required by applicable law, it is not undertaken, and specifically disclaimed, that there is any intention or obligation to update or revise the forward-looking statements, whether as a result of new information, future events or otherwise. Before acting on any recommendation, you should consider whether it is suitable for your particular circumstances and, if necessary, seek professional
advice.
The particulars contained herein were obtained from sources which we believe are reliable, but are not guaranteed by us and may be incomplete. This is not an official publication or research report of either Echelon Partners or Purpose Investments, and this is not to be used as a solicitation in any jurisdiction.
This document is not for public distribution, is for informational purposes only, and is not being delivered to you in the context of an offering of any securities, nor is it a recommendation or solicitation to buy, hold or sell any security.