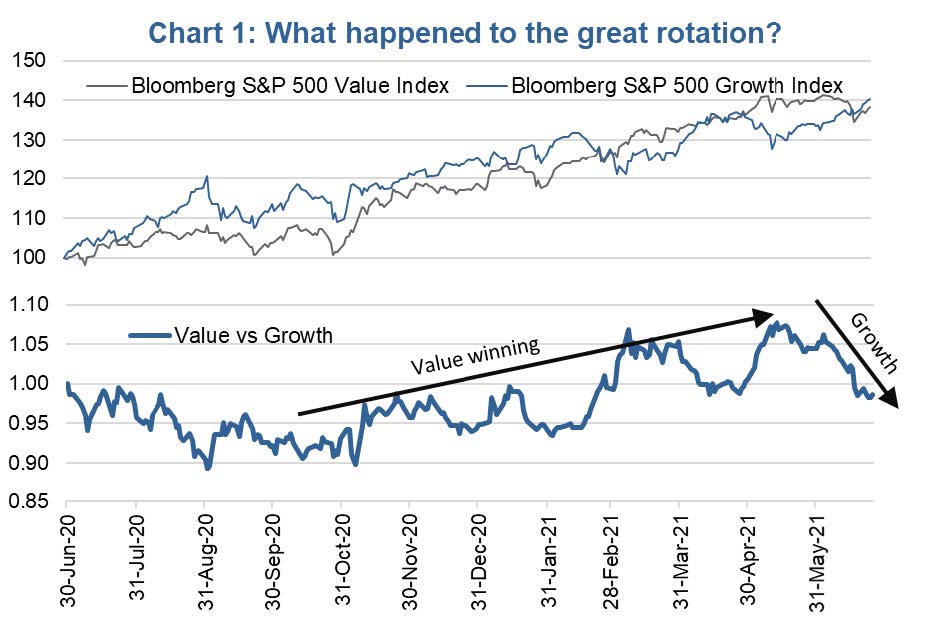
Starting in mid-May, growth began to outperform, rebounding from earlier weakness. Meanwhile value appreciation stalled. Of interest, this reversal coincided with bond yields following the same pattern. After rising since last summer, the yield on the 10-year Treasury fell from 1.70% to 1.42% a week ago. There is a pretty strong correlation between changes in bond yields and the relative performance of value and growth.
The connection is logical. Bond yields tend to rise when the economic growth prospects are improving. Better economic growth benefits value companies more than growth for a few reasons. Firstly, value has greater weights in sectors that are more cyclical. Secondly, better economic growth means more companies are growing earnings; this reduces the scarcity of growth that sometimes occurs, favouring growth stocks.
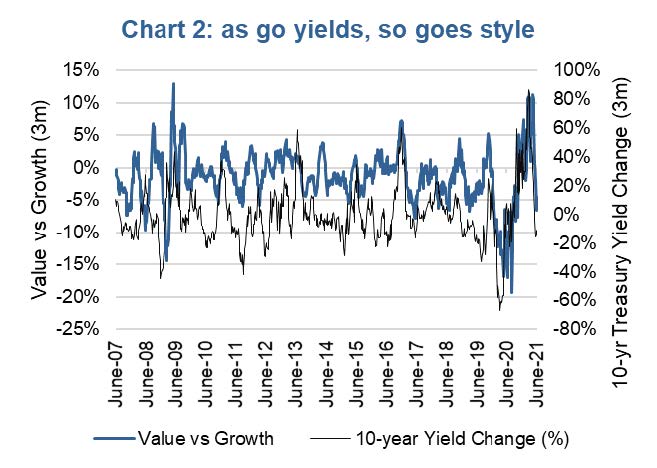
Chart 2 is the 3-month percentage change in the 10-year Treasury yield and the 3-month relative performance of value vs growth. It is not a perfect relationship but the correlation is material and significant. So even though yields have come back down a bit, if you believe yields will rise in the coming months or quarters, value remains the better style tilt.
There is also no denying the valuation gap remains elevated to the extreme between value and growth. Currently, growth is trading at 27.3x and value at 17.1x forward earnings. To be fair, index valuations are market cap weighted averages of the underlying company valuations. And averages can be very misleading. For example, a person with their head in the oven and their feet in the freezer, on average should be just fine. But we know that won’t work.
A spread of 10 valuation points between value and growth is in the 98th percentile extreme based on the past twenty years (chart 3), meaning growth is very expensive compared to value. Add the yield outlook to the valuation spread, improving economic growth, improving earnings growth, inflation outlook, and these factors all favour value over growth. We believe this rotation, despite a short-term setback, is just getting started.
Charts are sourced to Bloomberg L.P. unless otherwise noted.
The contents of this publication were researched, written and produced by Richardson Wealth Limited and are used herein under a non-exclusive license by Echelon Wealth Partners Inc. (“Echelon”) for information purposes only. The statements and statistics contained herein are based on material believed to be reliable but there is no guarantee they are accurate or complete. Particular investments or trading strategies should be evaluated relative to each individual's objectives in consultation with their Echelon representative.
Forward Looking Statements
Forward-looking statements are based on current expectations, estimates, forecasts and projections based on beliefs and assumptions made by author. These statements involve risks and uncertainties and are not guarantees of future performance or results and no assurance can be given that these estimates and expectations will prove to have been correct, and actual outcomes and results may differ materially from what is expressed, implied or projected in such forward-looking statements.
The opinions expressed in this report are the opinions of the author and readers should not assume they reflect the opinions or recommendations of Echelon Wealth Partners Inc. or its affiliates. Assumptions, opinions and estimates constitute the author’s judgment as of the date of this material and are subject to change without notice. We do not warrant the completeness or accuracy of this material, and it should not be relied upon as such. Before acting on any recommendation, you should consider whether it is suitable for your particular circumstances and, if necessary, seek professional advice. Past performance is not indicative of future results. These estimates and expectations involve risks and uncertainties and are not guarantees of future performance or results and no assurance can be given that these estimates and expectations will prove to have been correct, and actual outcomes and results may differ materially from what is expressed, implied or projected in such forward-looking statements.
The particulars contained herein were obtained from sources which we believe are reliable, but are not guaranteed by us and may be incomplete. The information contained has not been approved by and are not those of Echelon Wealth Partners Inc. (“Echelon”), its subsidiaries, affiliates, or divisions including but not limited to Chevron Wealth Preservation Inc. This is not an official publication or research report of Echelon, the author is not an Echelon research analyst and this is not to be used as a solicitation in a jurisdiction where this Echelon representative is not registered.
The opinions expressed in this report are the opinions of its author, Richardson Wealth Limited (“Richardson”), used under a non-exclusive license and readers should not assume they reflect the opinions or recommendations of Echelon Wealth Partners Inc. (“Echelon”) or its affiliates.
This is not an official publication or research report of Echelon, the author is not an Echelon research analyst and this is not to be used as a solicitation in a jurisdiction where this Echelon representative is not registered. The information contained has not been approved by and are not those of Echelon, its subsidiaries, affiliates, or divisions including but not limited to Chevron Wealth Preservation Inc. The particulars contained herein were obtained from sources which we believe are reliable, but are not guaranteed by us and may be incomplete.
Assumptions, opinions and estimates constitute the author’s judgment as of the date of this material and are subject to change without notice. Echelon and Richardson do not warrant the completeness or accuracy of this material, and it should not be relied upon as such. Before acting on any recommendation, you should consider whether it is suitable for your particular circumstances and, if necessary, seek professional advice. Past performance is not indicative of future results. These estimates and expectations involve risks and uncertainties and are not guarantees of future performance or results and no assurance can be given that these estimates and expectations will prove to have been correct, and actual outcomes and results may differ materially from what is expressed, implied or projected in such forward-looking statements.
Forward-looking statements are based on current expectations, estimates, forecasts and projections based on beliefs and assumptions made by author. These statements involve risks and uncertainties and are not guarantees of future performance or results and no assurance can be given that these estimates and expectations will prove to have been correct, and actual outcomes and results may differ materially from what is expressed, implied or projected in such forward-looking statements.