2021 Half Time with a big lead

The Echelon Insights Team • Jul 05, 2021

Market Recap – Just Keep Swimming


  • Looking back six months ago, we noted in our report that the setup for 2021 appeared ‘challenging’. Well, ‘challenging’ it was not. With the severity of the pandemic, vaccinations in early days and valuations at exorbitant levels, one would estimate that was a fair statement. An unbelievable run on equities so far this year has the markets defying everything from rising inflation to COVID-19 variants, with valuations in the nosebleed levels. No one can predict the future, but looking at chart 1, wouldn’t you agree that this looks a little ‘too easy’? However, if equities were a worry six months ago, we would say the paranoia of a pullback continues to increase. 


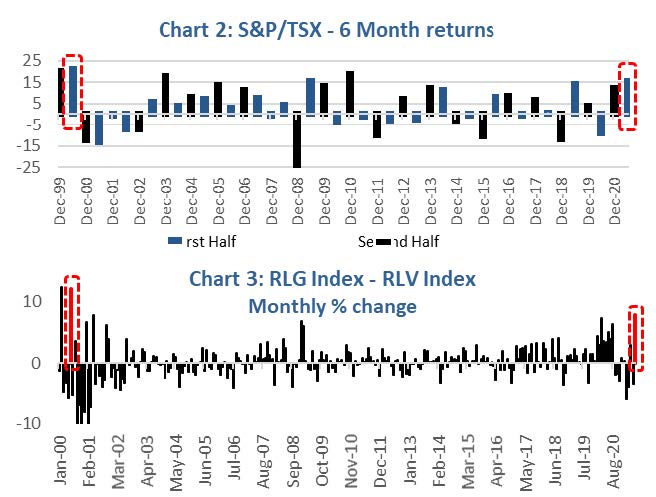
  • The strong run in 2021 for markets can be attributed to three things: strong growth, strong earnings and low interest rates. A very lackluster bond market is the icing on the cake. The S&P 500 registered its 5th straight month of gains, posting a +5.1% month in CAD for a six month return of +12.0%. The Nasdaq was the laggard early in the year, but really ramped up returns in June with a massive 8.4% CAD return. The 7th consecutive positive month out of 8 for the Nasdaq has the year to date return right up there with the rest of the major indices at +10.0% CAD. No one could have predicted that six months into 2021, Canada would be leading the world in equity returns. Shockingly, that is exactly where we are. It is so shocking in fact, that if you look at the historical six-month returns, the TSX posted its strongest first half return since 2000 (Chart 2). Although the halftime lead for Canada has condensed, we are still up 17.3% YTD. 


  • Growth style investing has really dominated value for much of the past decade. However, in late 2020 value started to outperform. All the stars were aligned for value including a sizeable valuation discount, the re-opening of the economy that would benefit value due to the constituents being more economically sensitive, rising yields and rising inflation. And it looked like the great value rotation had started … until last month cast some doubt. Value stalled and growth rebounded, mostly due to a pullback in bond yields. The reversal was so great that the Russell 1000 Growth index outperformed the Russell 1000 Value index by whopping +7.9%. The largest margin since, you guessed it, June 2000 (Chart 3). See the trend here? 


  • The CAD/USD pulled back in June by -2.7%, settling in around $0.80 halfway through the year but remaining positive on the year by +2.7%. Yields rose from the ashes this year, from trough to peak, almost doubling. But since then, the US 10-year has levelled off at around 1.47%. The true story with yields lies with the real yields pinned at -2.2% by elevated Core CPI. 


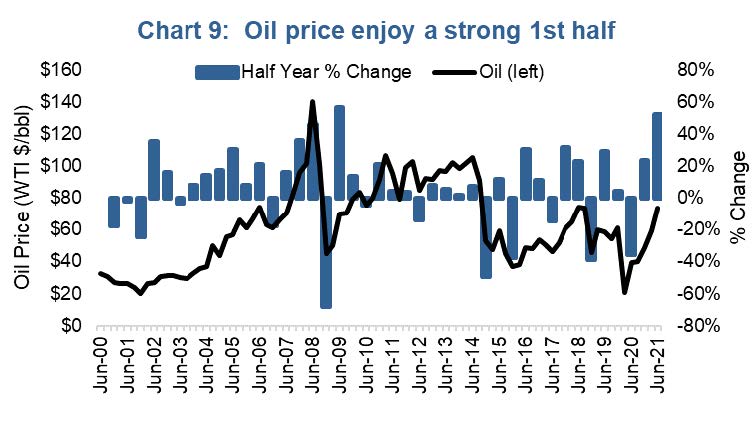
  • Stateside, large crude draws for the last five weeks show that the demand for oil continues to rise. New York WTI saw a +11% month to US$73.47/bbl. In any other year, this would be considered abnormal, but we have simply grown accustomed to these magnifiedmoves. With an improving economy and talks of eventual taper, Gold consolidated this month by -7% to US$1,770/oz. 


  • For the latter half of 2021, there are still risks remaining. Some choppy trading could ensure if the Fed continues discussing tapering or inflation runs too hot for too long. Unemployment benefits south of the border run out for many Americans in September which is something to keep an eye on too. But for now, as the great philosopher Dory said, Just keep swimming. 

Re-opening Economy


  • It may not feel like it just yet in parts of Canada (still in the queue for a haircut), but the re-opening of parts of the global economy hindered by the pandemic continues. The U.S. was an early mover and now Europe, Canada and other regions are moving quickly in the same direction. This is thanks to an increasing rollout of vaccines, falling new cases and decreased hospitalization. Combined, this will provide a solid boost to economic activity in the months and quarters ahead.


  • The momentum in high frequency economic mobility data has been improving at an increased pace in the U.S. The average number of travellers passing through airport security has surpassed 2m/day, a level on par with pre-pandemic levels. Given international and business travel remains subdued, this is a impressive feat and demonstrates the levels of pent up demand to get out, do things and spend money. Travel trends are improving globally as well. Hotels, restaurants and clothing; the consumer is coming back and appears ready to spend.


  • The average savings rate of the U.S. consumer has been 16% over the past year and a half, given an inability or reluctance to spend on things like dining out and travel. Even if a reasonable portion of these savings are spent in the quarters ahead as the rest of the economy reopens, this should continue to help fuel above-average economic growth. Add to this a solid wealth effect, thanks to record high markets and housing prices, and this should easily outweigh any reduction in government stimulus.  


  • Overall the economy is in great shape as we head into the 2nd half of 2021 even with employment lagging on the recovery pace. The consensus growth estimates for various economies around the globe continue to see upward revisions (Chart 4). We would point out the U.S. prospects improved first and we are now starting to see improving outlooks for emerging markets, Asia and Europe.


  • The economy is entering what we believe will be an over-energized phase. The lift from stimulus spending policies continues and will have a residual economic impact for the coming quarters. Meanwhile, spending on durables, the go-to strategy during the past year + of social distancing, will likely continue for a bit, partially due to shortages. And with services coming back stronger, even the above rosy economic forecasts may prove low.  


  • That being said, spending patterns are likely going to change dramatically over the next year. The pace of spending on durables,such as cars, homes, furniture and electronics, will slow dramatically as we begin spending in other categories. Plus, if you have a new car from 2020, you probably won’t buy another new one for a while.  


  • We are starting to see some loss of momentum in the PMI data for durables and improving data for services (Chart 5). Given spending on durables has a better economic and equity market earnings boost, this may become a drag. But that is far enough down the road especially since the momentum for both remains largely positive.  


  • This economy is al’right.

Asset Allocation – Market Cycle & Portfolio Positioning


  • With the global economy on the uptrend, it’s not surprising that our market cycle indicators remain healthy and elevated. Leading indicators are rising at a healthy pace, transports from rail to trucking are seeing solid increases and manufacturing data from Purchasers Managers Index (PMI) to chemical activities are at or near record highs for increases. Global indicators from oil to copper are appreciating, ocean shipping rates are up, global PMI data is strong, Korea is up (its equity market is very sensitive to global trade) and emerging markets are on the rise. Market momentum is positive for the most part.


  • Valuations remain elevated (i.e. they are high). Global equities, including all developed markets, are trading at about 19x forward earnings. Valuations are highest in the U.S. (22.4) while lower in Europe (16.3) and Canada (15.9). Note that relatively lower valuations does not equal cheap. On a positive note, earnings growth for global equities is forecast at about 10% in each of the next couple years. That certainly helps somewhat with the elevated valuations and if the economic growth does come in above forecasts, earnings may follow suit. Still, not cheap out there.


  • The only other blemish among the market cycle indicators is the yield curve. While still positively sloped, a good sign, it flattened significantly during the past month. Three-month T-bill yields picked up a bit, mainly due to some central bank engineering with the repo market (a much longer story), while the bigger mover was the 10-year yield dropping. A drop of 1.62 to 1.45% over the past few months isn’t a huge move but it is a little surprising given the pace of the economy recovery and inflation data. We believe this is a consolidation phase following a rise in yields from last summer, with the next move being to the upside. 


  • As we move into the 2nd half of 2021, we remain roughly equal weight in equities with holding a bit extra cash (dry powder) at the expense of bonds. While the economy is on a clear healthy path, we believe a move up in yields will trigger a consolidation or period of weakness. This should be viewed as a buying opportunity, hence the elevated cash level.


  • We continue to recommend overweighting international equities. Valuations are more attractive (albeit not cheap). More importantly, the leverage to improving global growth is better outside the U.S. market. Within U.S equities, we remain tilted to a more value bent along with dividends.  


  • Fixed income is underweight with lower duration. Credit spreads are very narrow but given the economic backdrop we continue to remain comfortable with credit exposure. 


  • The CAD has been very strong over the past year relative to the U.S. dollar. While we do see longer-term headwinds for the U.S. dollar, above 80 cents we tend to be sellers of CAD (buyers of USD) on a more short-term tactical basis.  


  • Overall, we remain constructive on markets looking out a few quarters with a current elevated correction risk. 

Inflation & Energy


  • In the United States, personal consumption (PCE) Inflation rose to 3.4% year over year, the highest levels since the 1990s. The consumer price index for urban consumers reached 5.0%, a level not seen since the last recession in 2008. 


  • Despite rising inflation, the Fed held steadfast to its view that they will not react preemptively to higher inflation. “We will not raise interest rates
    preemptively because we fear the possible onset of inflation. We will wait for evidence of actual inflation or other imbalances.” Fed Chair, Jay Powell


  • Several fundamental factors drove prices higher; most industries had to reconfigure their business model, supply chains have been disrupted and commodity prices have risen across the board.


  • The math behind how inflation is calculated on a year over year basis, coupled with the reduction in stimulus checks, makes it quite plausible that we are experiencing peak cycle inflation. 


  • Canada is a few months behind the U.S. recovery; restrictions were easing stateside at the start of the year while tightening north of the border. This could provide insight into the next few months. 


  • We are likely to experience similar challenges in job growth, but with better labour force participation and higher vaccination rates it is unlikely to be
    as bad. 


  • Incomes in the U.S fell for a second straight month in May as more states are dialing back stimulus, making a rise in prices even more challenging for items like houses and cars.


  • Median home prices in the U.S. rose 24% year over year on low inventories and strong demand. However, the lack of affordability has weighed on the pace of sales; existing home sales pulled back for the fourth straight month. 


  • Used car prices have spiked the highest out of any line item of CPI (outside energy), up 29.7% YoY. 


  • On a positive note for retailers, we have seen a surge in U.S. retail sales over the past four months, while there has been retracement in Canada. This is likely to reverse and accelerate over summer. 


  • The largest contributing factor to rise in inflation has been the rise in oil prices. CPI data for urban consumers in the United States show that consumers are paying 28.5% more for energy than they were a year ago


  • Oil prices closed out the quarter with the strongest half year performance since 2009. Recovery driven demand proved to be enough to offset increasing supply from North America and abroad as OPEC+ begins opening the taps. 


  • Oil is one of the only commodities not to correct so far, and historically there has been a high correlation between headline inflation and WTI. 


  • Most commodities, not just oil, capped off historic runs, but more recently have undergone healthy corrections. Lumber is off more than 30% from the peak while semiconductors, wheat and iron ore are all down 15%+.

Currency


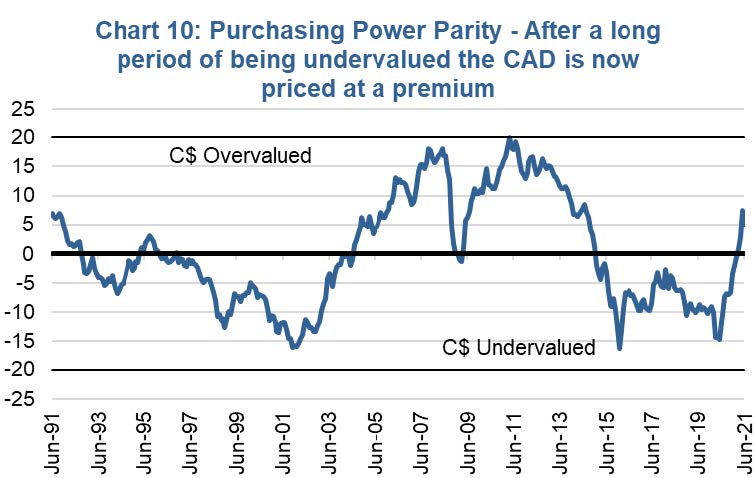
  • Although June was tough for the Canadian dollar, losing roughly 2.8% against the U.S. dollar, it still managed to fare relatively well compared to other currencies, finishing second to the Japanese Yen in relative performance to the USD. Year to date, the Canadian dollar retains the top spot among G10 currencies, despite dipping from its lofty heights. The recent U.S. dollar stabilization quickly developed into an impressive rebound thanks to a more hawkish than expected Fed. 


  • The direction of the Canadian dollar is directly impacted by risk-sentiment and closely tied to the ‘reflation’ theme. Should this theme reassert itself, we could expect some further appreciation over the coming months. However, we are not in the commodity‘super cycle’ camp so we see little reason for it to appreciate meaningfully above ‘fair value’ –which is roughly where it is at this moment as you can see in Chart 10. After years of being undervalued, the loonie is one of just a few currencies that is currently trading at a premium to the U.S. dollar. 


  • Looking at long-term currency charts, it may seem like the recent Canadian dollar appreciation is relatively modest, considering it was trading above par just nine years ago. There are a number of important factors that could constrain the magnitude of any further moves. First, from a valuation perspective the C$ is already trading at a premium with the U.S. dollar. Second, the BoCis keenly aware of the competitiveness issues that arise with a strong loonie, and would be wary to stoke any further competitive disadvantages. Third, domestically generated inflation is not as high as in the United States and the BoC may not be in as much of a rush to tighten. And finally, further commodity price appreciation is certainly possible, but most commodities are already coming off of historically elevated levels. We do not view the pricing environment as strong enough to warrant a return to “commodity/oil supercycle” levels for USD/CAD. Parity is a long way off, and we believe it is an unlikely end goal. 


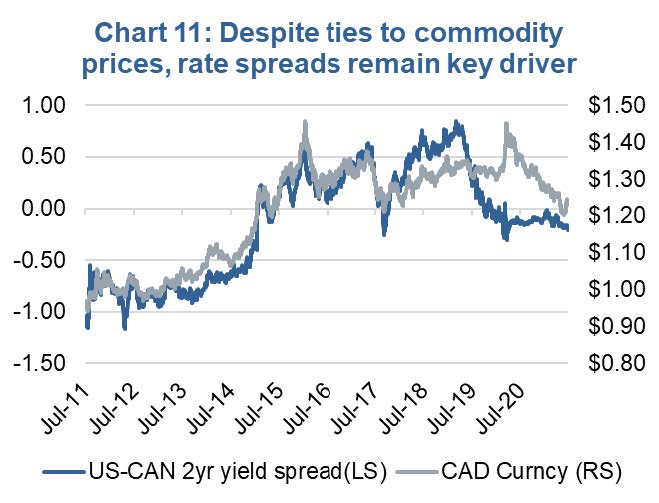
  • At present, a premium for Canadian two-year government bonds over similar U.S. securities justifies the recent strength but this spread has been rather stable for some time. (Chart 11)A divergence in interest rate moves is the key factor in future FX volatility, but it’s hard to have conviction in any major macro themes at the moment with so much resting on future central bank decisions. Future meetings will remain pivotal guideposts and as we’ve seen in June, any change in tone or language can cause swings in currency markets. A more data-dependent Fed and other central banks is a welcome sign to an eventual return to normalcy, but with it comes uncertainty tied to just what the future data will be. 


  • FX volatility remains depressed. It may not seem like it with the moves in the C$, but currency markets have been in a low-vol regime for almost a year. For this to change we would first need to see an increase in rate dispersion –so far nothing really to write about in terms of yield spreads. The big catalyst would be an increase in bond market volatility, or a pickup in taper talk and/or inflation fears. For now, both the median and mean forecasts for the Canadian dollar based on consensus forecasts has it trading roughly at current levels for the next four quarters. We don’t expect any major moves in the near-term and have been using the recent currency strength to add some U.S. equity exposure. 

Fixed Income – Taper Tantrum Two?


  • The pandemic that has raged around the globe for over a year has been met with monetary stimulus, that in many countries has exceeded what was provided during the financial crisis in 2009 or at any other time in history. This included bringing central bank interest rates back down to historic lows, and the introduction of bond-buying programs that increased money supply and fought off deflation.


  • The introduction of vaccines appears to be bringing the pandemic to an end in most developed nations, and hopefully this will continue globally as vaccine supply expands. The economic recovery appears to be well underway, and this should lead to reduced stimulus –first with a reduction in the amount of bonds purchased every month, followed by eventual interest rate hikes.


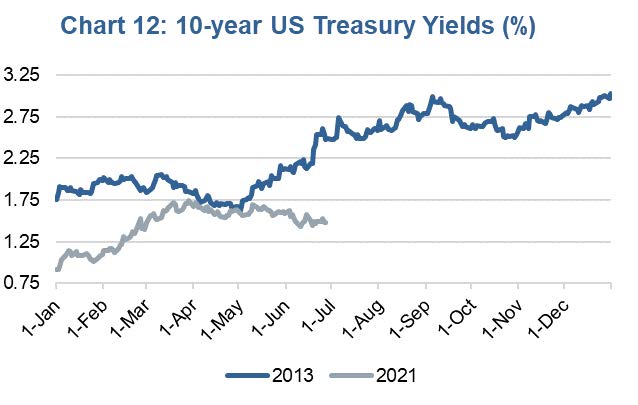
  • To gauge expectations on what the impact will be on bond markets when central banks reduce bond purchases, we can look to the“taper tantrum” that occurred in 2013 in the U.S. In the beginning of the second quarter of that year, after five years of outright bond purchases that saw the Fed’s ownership of Treasuries triple from $1 trillion to $3 trillion, then Fed Chair Bernanke announced the central bank would begin to reduce the volume of its bond purchases at some point in the future.


  • This perhaps unexpected move resulted in a significant upward move in rates, as the Fed “tapering” the pace of its purchases meant that the biggest buyer of Treasury bonds was going to slow down, likely eventually stop buying altogether and then maybe eventually start to sell. Ten-year Treasury yields rose from a low of 1.63% to 3.03% at year end.


  • Fast forward to 2021, and the pandemic has seen the Federal Reserve’s Treasury holdings grow from $4.2 trillion to $8.1 trillion, while the Bank of Canada’s holdings have grown from $105 billion to $398 billion. The Bank of Canada was one of the first central banks to begin reducing the amount of bonds it purchased each month, cutting the pace in April. There are expectations the Bank of England and the U.S. Federal Reserve will soon follow suit, while the European Central Bank is still likely many months away from a similar move.


  • Yields have already risen significantly, even though the pace of central bank buying hasn’t changed too much around the globe. Ten-year yields have risen from a low of 0.43% last summer in Canada to 1.42% today, while in the U.S. we have gone from a low of0.51% to 1.48%. 


  • Nonetheless, with stronger growth on the horizon, continued government spending, and an eventual rise in short-term rates, we continue to expect rates will continue to rise, which will see bond prices and total returns fall. For these reasons, we continue to recommend investors stay underweight fixed income within their strategic asset allocation models. 


  • Although short-term rates may rise more than long-term rates over the next 12-18 months, especially once we get our first rate hikes (which are expected early as the second half of 2022), price pressure will be less on shorter maturities, so a below market duration of bond holdings is also recommended at this time.

Charts are sourced to Bloomberg L.P. unless otherwise noted.


The contents of this publication were researched, written and produced by Richardson Wealth Limited and are used herein under a non-exclusive license by Echelon Wealth Partners Inc. (“Echelon”) for information purposes only. The statements and statistics contained herein are based on material believed to be reliable but there is no guarantee they are accurate or complete. Particular investments or trading strategies should be evaluated relative to each individual's objectives in consultation with their Echelon representative. 


Forward Looking Statements


Forward-looking statements are based on current expectations, estimates, forecasts and projections based on beliefs and assumptions made by author. These statements involve risks and uncertainties and are not guarantees of future performance or results and no assurance can be given that these estimates and expectations will prove to have been correct, and actual outcomes and results may differ materially from what is expressed, implied or projected in such forward-looking statements.


The opinions expressed in this report are the opinions of the author and readers should not assume they reflect the opinions or recommendations of Echelon Wealth Partners Inc. or its affiliates. Assumptions, opinions and estimates constitute the author’s judgment as of the date of this material and are subject to change without notice. We do not warrant the completeness or accuracy of this material, and it should not be relied upon as such. Before acting on any recommendation, you should consider whether it is suitable for your particular circumstances and, if necessary, seek professional advice. Past performance is not indicative of future results. These estimates and expectations involve risks and uncertainties and are not guarantees of future performance or results and no assurance can be given that these estimates and expectations will prove to have been correct, and actual outcomes and results may differ materially from what is expressed, implied or projected in such forward-looking statements.

The particulars contained herein were obtained from sources which we believe are reliable, but are not guaranteed by us and may be incomplete. The information contained has not been approved by and are not those of Echelon Wealth Partners Inc. (“Echelon”), its subsidiaries, affiliates, or divisions including but not limited to Chevron Wealth Preservation Inc. This is not an official publication or research report of Echelon, the author is not an Echelon research analyst and this is not to be used as a solicitation in a jurisdiction where this Echelon representative is not registered.


The opinions expressed in this report are the opinions of its author, Richardson Wealth Limited (“Richardson”), used under a non-exclusive license and readers should not assume they reflect the opinions or recommendations of Echelon Wealth Partners Inc. (“Echelon”) or its affiliates.


This is not an official publication or research report of Echelon, the author is not an Echelon research analyst and this is not to be used as a solicitation in a jurisdiction where this Echelon representative is not registered. The information contained has not been approved by and are not those of Echelon, its subsidiaries, affiliates, or divisions including but not limited to Chevron Wealth Preservation Inc. The particulars contained herein were obtained from sources which we believe are reliable, but are not guaranteed by us and may be incomplete.


Assumptions, opinions and estimates constitute the author’s judgment as of the date of this material and are subject to change without notice. Echelon and Richardson do not warrant the completeness or accuracy of this material, and it should not be relied upon as such. Before acting on any recommendation, you should consider whether it is suitable for your particular circumstances and, if necessary, seek professional advice. Past performance is not indicative of future results. These estimates and expectations involve risks and uncertainties and are not guarantees of future performance or results and no assurance can be given that these estimates and expectations will prove to have been correct, and actual outcomes and results may differ materially from what is expressed, implied or projected in such forward-looking statements.


Forward-looking statements are based on current expectations, estimates, forecasts and projections based on beliefs and assumptions made by author. These statements involve risks and uncertainties and are not guarantees of future performance or results and no assurance can be given that these estimates and expectations will prove to have been correct, and actual outcomes and results may differ materially from what is expressed, implied or projected in such forward-looking statements. 

Echelon’s Insight Team


Echelon’s Insight Team includes members in various departments such as Wealth Management, Capital Markets, Marketing, Talent, and Compliance who have subject matter expertise and collaborate together to build quality content to help our clients. This team approach helps us ensure content is produced that is meaningful, accurate and timely.

06 May, 2024
Take your pick. There is no shortage of both good and bad news floating about the financial markets. To be fair, this is always the case. The hard part is understanding which side is stronger today and which side will be stronger tomorrow. With markets up low to mid-single digits following a very strong Q4 finish to 2023, most would agree the optimists are carrying the day at the moment. It is not just rose-coloured glasses; there is good news out there. Economic growth signs or momentum appear to be improving year-to-date. Dial back a few quarters, and the U.S. economy remained resilient while other economies softened or were rather lacklustre, including Canada, Europe, Japan, and China, to highlight some of the biggies. Today, while Canada is struggling, momentum in the U.S. has moved even higher, and there are signs of improvement in most jurisdictions.
29 Apr, 2024
There are three things you should rarely ever bet against: the Leaf’s opposing team in the playoffs, the American consumer’s ability to spend, and corporate profits. As we are now about halfway through U.S. earnings season, once again, positive surprises remain the norm; 81% have beaten. It's a bit better than the 20-year average of 75%. The fact is that companies are good at managing analysts’ expectations. At least enough to beat them when the numbers hit the tape. The size of the positive surprises have been encouraging as well, at just under 10%. The highest surprise magnitude in some time.  One of our reservations on the sustainability of this market rally over the past couple of quarters has been the flat earnings revisions. In other words, global markets are up over 20% but earnings estimates have remained flat or tilted down slightly. More often than not, markets trend in the same direction as earnings revisions. Earnings get revised up when companies raise guidance and/or analysts become more encouraged about growth prospects. That is a good thing for markets. Obviously, downward revisions are bad. Yet estimates have remained very flat as markets marched higher, a challenging combination.
22 Apr, 2024
The oil market has been interesting lately and, to the surprise of many, has been the biggest silent outperformer this year. There is no shortage of geopolitical events to choose from that’s leading to a higher risk premium in oil with Brent breaking $90, whether it’s the Houthis missile attacks in the Red Sea leading to a massive re-route of trade, Ukraine’s drone strikes on Russian refineries, and the latest escalation between Israel and Iran leading to some news outlets using WWIII as click bait-y headlines. Given the run-up in oil prices, Canadian oil equities have clearly benefitted from the much higher torque. But there is a layer of even better news: The Transmountain Expansion (TMX) continues to look to be in operation by May, which would lead to much better pricing on the Western Canadian Select (WCS). With the current setup for the oil markets, some key questions that we often get from investors are: How sustainable is the rally in Canadian energy names? To determine if the oil equities are overstretched, we can look at the debt-adjusted cash flow (DACF) multiples of the major integrated oil names and see how the valuation has shifted in light of the recent oil move. From Exhibit 1, the DACF multiples for the Canadian integrated have been fairly range-bound over the last year, also in line with WTI, which has been in the $70 - $85 range. As a starting point, we can infer that the valuations of the companies have been commensurate with the movements in the underlying oil price deck and in line with where the equities should trade in the cycle historically over the last couple of years. Typically, in the commodities cycle, higher prices are usually coupled with lower multiples as market participants will usually price in lower normalized prices and vice versa, so a cause of concern would be if valuation starts trending towards the 6.5x – 7.0x+ area if oil prices continue to stay in the upper bounds of the $70 - $90 range or higher.
MORE POSTS →
Share by: