Nothing lasts forever – thankfully this includes pandemics. And while the path out likely remains a hilly road with ups and downs, people’s behaviour appears to be inching back towards normal. This is clearly good news. With each jab in the arm, we move a small step closer towards the new normal. This pandemic has obviously triggered a great number of advancements across medicine, logistics, manufacturing, etc. One of the advancements in the world of economics has been the rising use and availability of higher frequency data. Economic data, generally, takes time to tabulate, report and then is often revised. GDP, for example, is reported about 3-4 weeks after the quarter ends, and revised multiple times over the coming months. In the end you have a clear picture of what happened a year ago. Not very useful for investing given how fast markets move.
High frequency data attempts to capture some measure of economic activity closer to real time. The most obvious benefit is that it can provide a glimpse of what is happening today: are things improving, deteriorating or remaining stable. The downside is because it is relatively new, its efficacy remains a bit of a wildcard. In this edition we will look at some of these high frequency data points to show that the economic re-opening is gaining momentum. In fact, this momentum is starting to show up in retail sales which is a more traditional economic data point, providing increased proof that the high frequency data can be a leading precursor to the more traditional data.
These trends are similar across a number of measures. Box office tickets sold for movie goes, restaurant reservations (we just made one for this week) and back to work trends. This is all good news.
The sweet spot
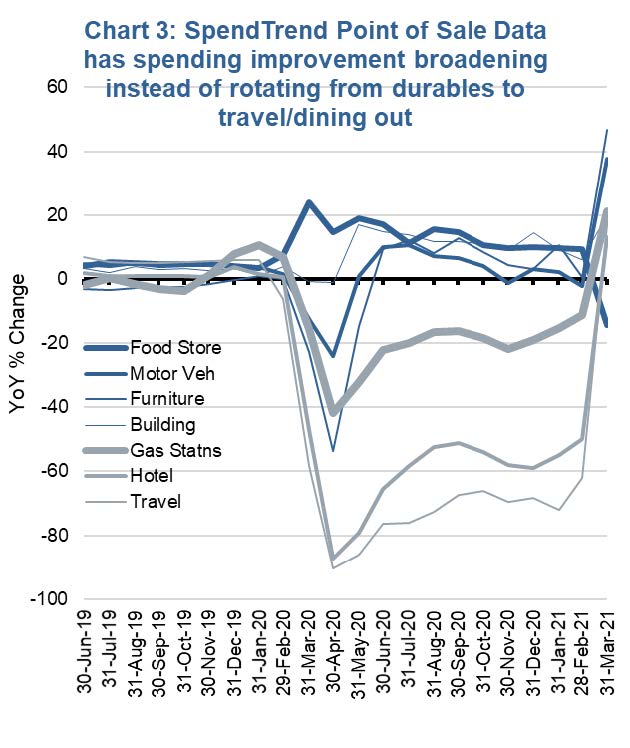
As we highlighted in “A dollar is not just a dollar” report on May 10, consumption spent on durable goods such as cars or home improvements have a bigger economic and equity earnings impact compared to most leisure spending Concern remains that as spending reverts to a more balanced mix, this could become a drag. So far that is not the case. Spending on durables has remained elevated while spending on services such as travel and leisure has started to improve. Evidence of this trend can bee seen in the retail sales data and Chart 3. This would support the view that there is excess savings out there and a strong demand to spend.
Charts are sourced to Bloomberg L.P. unless otherwise noted.
The contents of this publication were researched, written and produced by Richardson Wealth Limited and are used herein under a non-exclusive license by Echelon Wealth Partners Inc. (“Echelon”) for information purposes only. The statements and statistics contained herein are based on material believed to be reliable but there is no guarantee they are accurate or complete. Particular investments or trading strategies should be evaluated relative to each individual's objectives in consultation with their Echelon representative.
Forward Looking Statements
Forward-looking statements are based on current expectations, estimates, forecasts and projections based on beliefs and assumptions made by author. These statements involve risks and uncertainties and are not guarantees of future performance or results and no assurance can be given that these estimates and expectations will prove to have been correct, and actual outcomes and results may differ materially from what is expressed, implied or projected in such forward-looking statements.
The opinions expressed in this report are the opinions of the author and readers should not assume they reflect the opinions or recommendations of Echelon Wealth Partners Inc. or its affiliates. Assumptions, opinions and estimates constitute the author’s judgment as of the date of this material and are subject to change without notice. We do not warrant the completeness or accuracy of this material, and it should not be relied upon as such. Before acting on any recommendation, you should consider whether it is suitable for your particular circumstances and, if necessary, seek professional advice. Past performance is not indicative of future results. These estimates and expectations involve risks and uncertainties and are not guarantees of future performance or results and no assurance can be given that these estimates and expectations will prove to have been correct, and actual outcomes and results may differ materially from what is expressed, implied or projected in such forward-looking statements.
The particulars contained herein were obtained from sources which we believe are reliable, but are not guaranteed by us and may be incomplete. The information contained has not been approved by and are not those of Echelon Wealth Partners Inc. (“Echelon”), its subsidiaries, affiliates, or divisions including but not limited to Chevron Wealth Preservation Inc. This is not an official publication or research report of Echelon, the author is not an Echelon research analyst and this is not to be used as a solicitation in a jurisdiction where this Echelon representative is not registered.
The opinions expressed in this report are the opinions of its author, Richardson Wealth Limited (“Richardson”), used under a non-exclusive license and readers should not assume they reflect the opinions or recommendations of Echelon Wealth Partners Inc. (“Echelon”) or its affiliates.
This is not an official publication or research report of Echelon, the author is not an Echelon research analyst and this is not to be used as a solicitation in a jurisdiction where this Echelon representative is not registered. The information contained has not been approved by and are not those of Echelon, its subsidiaries, affiliates, or divisions including but not limited to Chevron Wealth Preservation Inc. The particulars contained herein were obtained from sources which we believe are reliable, but are not guaranteed by us and may be incomplete.
Assumptions, opinions and estimates constitute the author’s judgment as of the date of this material and are subject to change without notice. Echelon and Richardson do not warrant the completeness or accuracy of this material, and it should not be relied upon as such. Before acting on any recommendation, you should consider whether it is suitable for your particular circumstances and, if necessary, seek professional advice. Past performance is not indicative of future results. These estimates and expectations involve risks and uncertainties and are not guarantees of future performance or results and no assurance can be given that these estimates and expectations will prove to have been correct, and actual outcomes and results may differ materially from what is expressed, implied or projected in such forward-looking statements.
Forward-looking statements are based on current expectations, estimates, forecasts and projections based on beliefs and assumptions made by author. These statements involve risks and uncertainties and are not guarantees of future performance or results and no assurance can be given that these estimates and expectations will prove to have been correct, and actual outcomes and results may differ materially from what is expressed, implied or projected in such forward-looking statements.