Okay, if we knew the answer our residence would likely be on a nice warm private island somewhere. The fact is market advances that roll into corrections or bear markets don’t follow a pre-determined pattern or playbook.
It isn’t the Fed or monetary missteps that necessarily end a cycle, although it can be. It isn’t a slowing economy either, sometimes this comes after or sometimes before the top. Cycles in normal times are unique, each with their own characteristics, leaders, nuances, and inevitable paths. And even if there are some commonalities, can we really apply those for today’s market?
It is with nervous fingers that I type “it is different this time.” But really, if this time isn’t different with a two-year+ global pandemic, trillions of stimulus sloshing about the system, and equity markets 35% higher than before the pandemic, then when would it ever be different?
Bull runs can end for any number of reasons. Truth be told, it is after the fact that the financial narrative fills in the blanks as to what caused the bull to turn bearish. And consensus forms around the most popular or plausible narrative. This sort of rear-view analysis isn’t going to help investors much, but it does provide loads of content for those writing about the markets (present company included).
While the likely triggers that end a bull cycle vary, there are some commonalities when looking within the market itself:
1. It doesn’t happen overnight – you don’t wake up one morning and find a bull market has turned into a bear. In fact, as bull markets near their end, there is often added volatility in both directions as the bull and bear metaphorically fight it out for who will prevail. 2020 was an exception given it was caused by an exogeneous shock, but then again it remains a debate as to whether the previous bull ended or are we still in the same bull market cycle that started in 2009 (a topic for another Ethos…).
It’s normal for there to be a topping pattern of some sort. So, while 2022 may be off to a wobbly start (perhaps triggered by increasing hints the Fed may become more aggressive in dialing back stimulus),
given that new market highs were made so recently, this wobble shouldn’t be much of a concern (for now).
2. Change in market leadership – bull markets continue because the leaders keep making new highs. The leaders suffer some pullbacks along the way but continue to lead. Sure, maybe a simplification, but each bull market has leaders that are benefitting more than most because of the economy, behaviours, or investor appetites. Consider technology companies in the 1990s, financial/resource companies in the 2000s, and network/digital companies in the latest cycle.
At some point, the leaders falter because of a specific catalyst or simply from excess. One constant in the financial world is that when something is working, people pile in. Products/companies are created, and, inevitably, things go too far. In part, this is what drives cycles.
This is where things are a bit more challenging. The leaders have not been leading over the past few months, and this trend has accelerated in the early days of 2022. We all cheer value for making a bit of a comeback compared with growth—but be careful what you wish for.
A comeback for value vs growth may lead to the end of the bull, simply because value doesn’t have the weight in the index to offset a fall in growth names,
referring to the S&P 500. A 5% drop in shares of Apple hit the S&P 500 much harder than the lift from a 5% rise in Bank of America. Of course, an optimist hopes for value to rise while growth pauses, but that is not the norm.
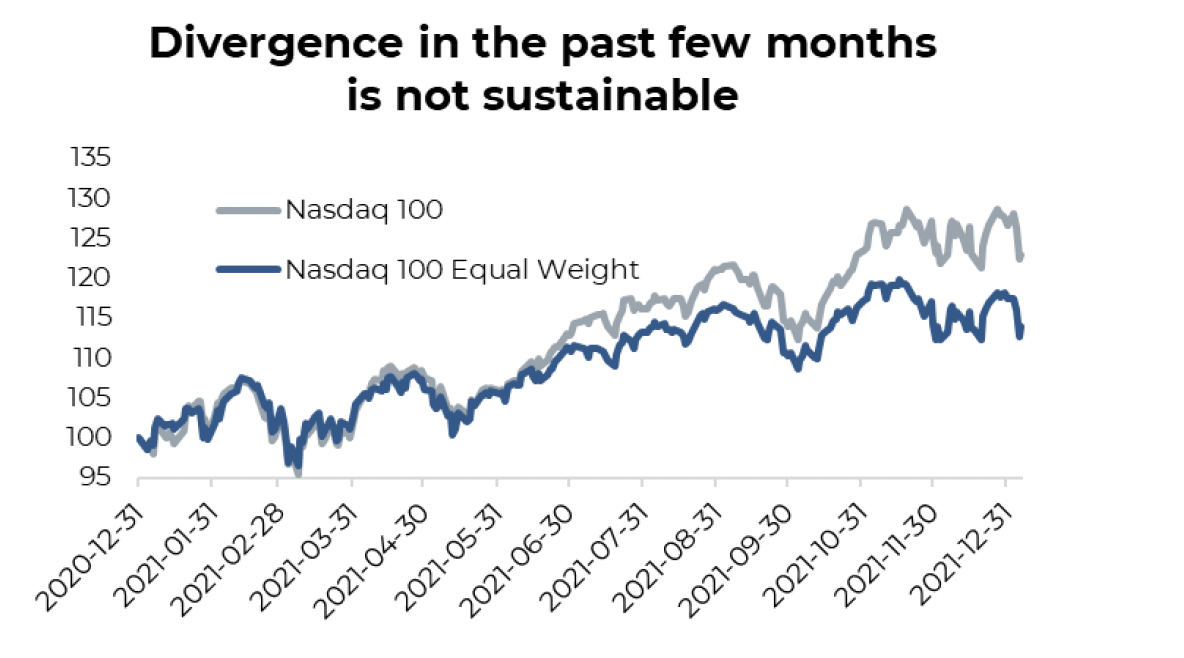
As another potential harbinger of changing leadership, we can look down the growth spectrum. Much has been published on the performance of non-profitable technology companies. If there is a change in leadership away from tech, you could argue the non-profitable technology companies may feel the changing attitudes first. This trend is also evident comparing the NASDAQ 100 vs the NASDAQ 100 Equal Weight. The first is a cap weighted index, so Apple is 12% and Microsoft 10%. Equal weight, well, each company carries about a 1% weight.
The equal weight has been flat for the past few months, as gains in the index have only been driven by those large names. This lack of breadth is added risk for the market and a warning that the leaders are under pressure.
Investment implications
There are certainly some concerning trends underneath the surface of the major indices, which would support a bit more of a defensive stance. But it is certainly premature to sound any end of cycle alarm bells.
2022 is going to be a more volatile year as the market begins to absorb the changing pace and direction of monetary policy around the world. The bulls and bears are more evenly matched this year, so it is likely going to be a tussle. And it appears to have begun.
Source: Charts are sourced to Bloomberg L.P. and Purpose Investments Inc.
The contents of this publication were researched, written and produced by Purpose Investments Inc. and are used by Echelon Wealth Partners Inc. for information purposes only.
This report is authored by Craig Basinger, Chief Market Strategist, Purpose Investments Inc.
The contents of this publication were researched, written and produced by Purpose Investments Inc. and are used herein under a non-exclusive license by Echelon Wealth Partners Inc. (“Echelon”) for information purposes only. The statements and statistics contained herein are based on material believed to be reliable but there is no guarantee they are accurate or complete. Particular investments or trading strategies should be evaluated relative to each individual's objectives in consultation with their Echelon representative.
Echelon Wealth Partners Ltd.
The opinions expressed in this report are the opinions of the author and readers should not assume they reflect the opinions or recommendations of Echelon Wealth Partners Ltd. or its affiliates. Assumptions, opinions and estimates constitute the author's judgment as of the date of this material and are subject to change without notice. We do not warrant the completeness or accuracy of this material, and it should not be relied upon as such. Before acting on any recommendation, you should consider whether it is suitable for your particular circumstances and, if necessary, seek professional advice. Past performance is not indicative of future results. The comments contained herein are general in nature and are not intended to be, nor should be construed to be, legal or tax advice to any particular individual. Accordingly, individuals should consult their own legal or tax advisors for advice with respect to the tax consequences to them.
Purpose Investments Inc.
Purpose Investments Inc. is a registered securities entity. Commissions, trailing commissions, management fees and expenses all may be associated with investment funds. Please read the prospectus before investing. If the securities are purchased or sold on a stock exchange, you may pay more or receive less than the current net asset value. Investment funds are not guaranteed, their values change frequently and past performance may not be repeated.
Forward Looking Statements
Forward-looking statements are based on current expectations, estimates, forecasts and projections based on beliefs and assumptions made by author. These statements involve risks and uncertainties and are not guarantees of future performance or results and no assurance can be given that these estimates and expectations will prove to have been correct, and actual outcomes and results may differ materially from what is expressed, implied or projected in such forward-looking statements. Assumptions, opinions and estimates constitute the author’s judgment as of the date of this material and are subject to change without notice. Neither Purpose Investments nor Echelon Partners warrant the completeness or accuracy of this material, and it should not be relied upon as such. Before acting on any recommendation, you should consider whether it is suitable for your particular circumstances and, if necessary, seek professional advice. Past performance is not indicative of future results. These estimates and expectations involve risks and uncertainties and are not guarantees of future performance or results and no assurance can be given that these estimates and expectations will prove to have been correct, and actual outcomes and results may differ materially from what is expressed, implied or projected in such forward-looking statements. Unless required by applicable law, it is not undertaken, and specifically disclaimed, that there is any intention or obligation to update or revise the forward-looking statements, whether as a result of new information, future events or otherwise.
Before acting on any recommendation, you should consider whether it is suitable for your particular circumstances and, if necessary, seek professional advice.
The particulars contained herein were obtained from sources which we believe are reliable, but are not guaranteed by us and may be incomplete. This is not an official publication or research report of either Echelon Partners or Purpose Investments, and this is not to be used as a solicitation in any jurisdiction.
This document is not for public distribution, is for informational purposes only, and is not being delivered to you in the context of an offering of any securities, nor is it a recommendation or solicitation to buy, hold or sell any security.