So far in 2021, the S&P 500 and the TSX are both up about 25%. A truly remarkable year for equity markets that were fueled by everything from fiscal spending, MONEY PRINTING, economic recovery, the retreat of a pandemic, and a sprinkling of inflation. Making this year even more remarkable is the breadth of the advance. This is NOT just Microsoft, Apple, and Shopify pushing their respective market cap-weighted indices higher. In fact, year to date, Microsoft is ranked 74th among the S&P 500 and Apple is way down the list at 314; Shopify is 56th out of the TSX’s 230 current index members. In other words, this market advance is much broader than many of years past.
This is good news for investors because an index that goes up, driven by just a few names, is just not healthy in terms of the sustainability of those gains; and it can be very frustrating if you do not own those few select names. In 2020, the S&P 500 rose by 18%, but the top 10 contributors represented 70% of the market’s advance. Basically, if you didn’t own those large cap leaders last year, you either lost or at least didn’t feel nearly as happy. But 2021 is much more balanced. While the market is up 25%, less than 40% has come from the top 10 contributors.
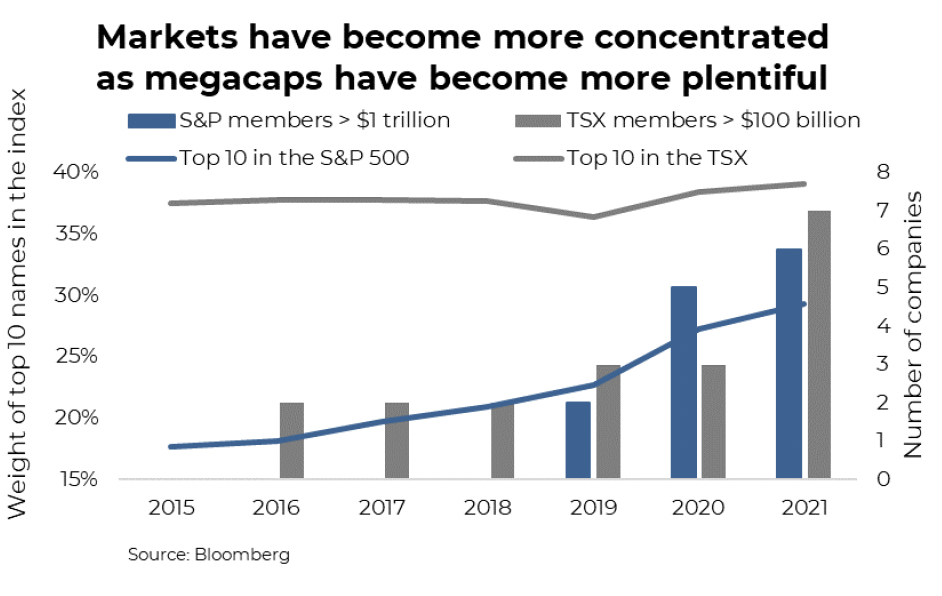
The S&P 500, TSX, and most indices are market capitalization or float-weighted – the bigger the company’s market cap, the heavier its weight in the index. And given the price appreciation of many of the super mega caps in recent history, the relative weighting in most indices is historically concentrated within a few names. Currently, there are six companies with a market cap over $1 trillion in the U.S. In 2018, there were none. In Canada’s TSX, we have 7 companies over $100 billion, but there were only three in 2019. The markets have gone up, of course, but the concentration in the mega caps has increased even more so.
This trend is more evident in the U.S. market. Today, the top 10 S&P 500 members represent 29.3% of the index – up from 20% a couple years ago. The TSX has always been less diversified than the U.S. market and does suffer from a long history of high concentration. Today, the top 10 names comprise 39% of the index, up slightly over the past few years.
So, why should investors care? If the performance dispersion is narrow and concentrated in those mega cap names (e.g., 2020), simply owning the market cap-weighted index is likely the preferred strategy. If dispersion is broad, this is a better environment for either active or factor-based strategies. Of course, the active manager must pick more of the stronger performing names, or the factors need to be the right ones for the market. However, there is a much greater chance of this in markets with high dispersion of returns vs a concentrated one. The odds get even greater if the high concentration names falter. Outperforming the Canadian market is much easier if the banks stumble; for the S&P 500, it’s tech.
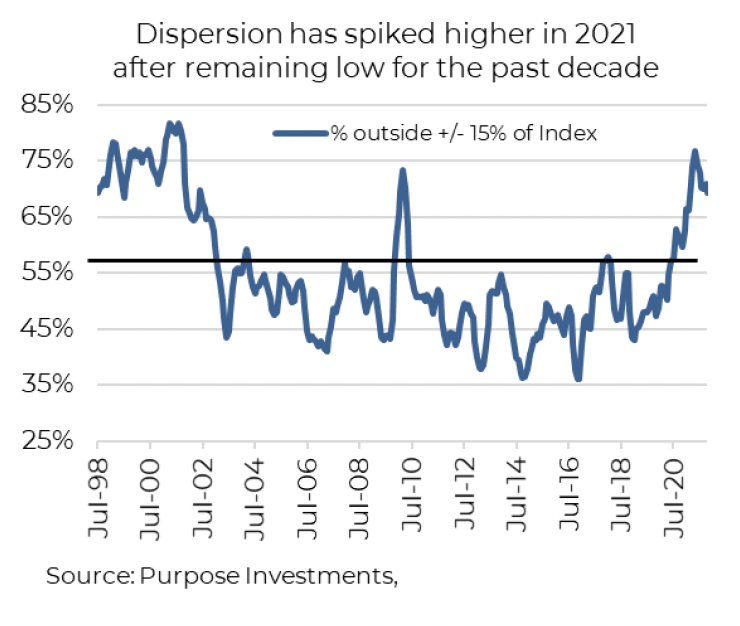
In 2021, we have seen a rise in dispersion within the S&P 500. To measure, we track the percentage of index members that are outside +/- 15% of the index performance based on the trailing year. So, if the market is up 10%, our dispersion measure is the percentage of companies up over 25% or down more than -5%. The more companies on the tails of this distribution, the higher the dispersion. When dispersion is low, it’s harder for active management to outperform. Even if more winners are picked, or losers avoided, the magnitude of the benefit for the overall portfolio is less. Or simply put, dispersion is good for active management…
…and dispersion has been rising.
There are several factors contributing to greater dispersion. Rising yields and inflation tend to impact companies very differently; some win and some lose. This increases dispersion and the fundamentals of companies start to matter more, which are seeing headwinds as we navigate a changing world. We appear to be transitioning from a more macro-driven market to one that is more micro, and that likely means higher dispersion.
Investment implications
Active vs passive is not a binary decision. Both have positive and negative characteristics from a portfolio construction perspective. Passive enjoys lower relative costs, albeit not to the same degree as years ago since active costs have come down. Active enjoys better risk management, especially when market cap-weighted indices are concentrated, such as these days. Usually folks just talk relative performance, with passive winning that debate in recent history. But this has come alongside increasing concentration in the index, which carries greater risk. Active and passive work best together, but sometimes more of one than the other, depending on the market environment and risks.
Since we believe index dispersion will remain elevated as we head into a potentially higher inflationary environment and the macro influence of central banks begin to recede, we currently have an active tilt within equity allocations. This tilt is likely to increase, given concentration risks in capitalization-weighted indices and a market that appears to be increasingly more micro-driven than macro.
Source: Charts are sourced to Bloomberg L.P. and Purpose Investments Inc.
The contents of this publication were researched, written and produced by Purpose Investments Inc. and are used by Echelon Wealth Partners Inc. for information purposes only.
This report is authored by Craig Basinger, Chief Market Strategist, Purpose Investments Inc.
The contents of this publication were researched, written and produced by Purpose Investments Inc. and are used herein under a non-exclusive license by Echelon Wealth Partners Inc. (“Echelon”) for information purposes only. The statements and statistics contained herein are based on material believed to be reliable but there is no guarantee they are accurate or complete. Particular investments or trading strategies should be evaluated relative to each individual's objectives in consultation with their Echelon representative.
Echelon Wealth Partners Ltd.
The opinions expressed in this report are the opinions of the author and readers should not assume they reflect the opinions or recommendations of Echelon Wealth Partners Ltd. or its affiliates. Assumptions, opinions and estimates constitute the author's judgment as of the date of this material and are subject to change without notice. We do not warrant the completeness or accuracy of this material, and it should not be relied upon as such. Before acting on any recommendation, you should consider whether it is suitable for your particular circumstances and, if necessary, seek professional advice. Past performance is not indicative of future results. The comments contained herein are general in nature and are not intended to be, nor should be construed to be, legal or tax advice to any particular individual. Accordingly, individuals should consult their own legal or tax advisors for advice with respect to the tax consequences to them.
Purpose Investments Inc.
Purpose Investments Inc. is a registered securities entity. Commissions, trailing commissions, management fees and expenses all may be associated with investment funds. Please read the prospectus before investing. If the securities are purchased or sold on a stock exchange, you may pay more or receive less than the current net asset value. Investment funds are not guaranteed, their values change frequently and past performance may not be repeated.
Forward Looking Statements
Forward-looking statements are based on current expectations, estimates, forecasts and projections based on beliefs and assumptions made by author. These statements involve risks and uncertainties and are not guarantees of future performance or results and no assurance can be given that these estimates and expectations will prove to have been correct, and actual outcomes and results may differ materially from what is expressed, implied or projected in such forward-looking statements. Assumptions, opinions and estimates constitute the author’s judgment as of the date of this material and are subject to change without notice. Neither Purpose Investments nor Echelon Partners warrant the completeness or accuracy of this material, and it should not be relied upon as such. Before acting on any recommendation, you should consider whether it is suitable for your particular circumstances and, if necessary, seek professional advice. Past performance is not indicative of future results. These estimates and expectations involve risks and uncertainties and are not guarantees of future performance or results and no assurance can be given that these estimates and expectations will prove to have been correct, and actual outcomes and results may differ materially from what is expressed, implied or projected in such forward-looking statements. Unless required by applicable law, it is not undertaken, and specifically disclaimed, that there is any intention or obligation to update or revise the forward-looking statements, whether as a result of new information, future events or otherwise.
Before acting on any recommendation, you should consider whether it is suitable for your particular circumstances and, if necessary, seek professional advice.
The particulars contained herein were obtained from sources which we believe are reliable, but are not guaranteed by us and may be incomplete. This is not an official publication or research report of either Echelon Partners or Purpose Investments, and this is not to be used as a solicitation in any jurisdiction.
This document is not for public distribution, is for informational purposes only, and is not being delivered to you in the context of an offering of any securities, nor is it a recommendation or solicitation to buy, hold or sell any security.