‘Tis the season for tax-loss selling: an annual rite of passage for both seasoned investors as well as investing neophytes.
When the days get darker and the mornings a little chillier, something curious begins to occur—that reluctance to sell those losing positions that didn’t work out flips to a willingness to discard those biggest losers almost as if price become irrelevant.
So why wait to the end of the year? Well, it’s complicated, but the decision-making process surrounding selling investments that didn’t work out centers around regret. Watching a stock continuously trend lower can be a painful gut-wrenching experience, especially when you feel you were right and everyone who is selling is acting irrationally. This can continue for some time and continue as a blemish on your portfolio. We’re hardwired to avoid the feeling of regret as much as possible and can go to great illogical lengths to avoid the feeling. It’s classic loss aversion, a prevalent behavioural bias that hard wires all of us to avoid pain. Pain in portfolio land is losing money. To avoid experiencing the pain of a “real” loss, investors often continue to hold onto a losing investment far too long. In their subconscious, if not their conscious, it’s easy to think a loss isn’t a loss as long as you don’t sell—because there is always a chance.
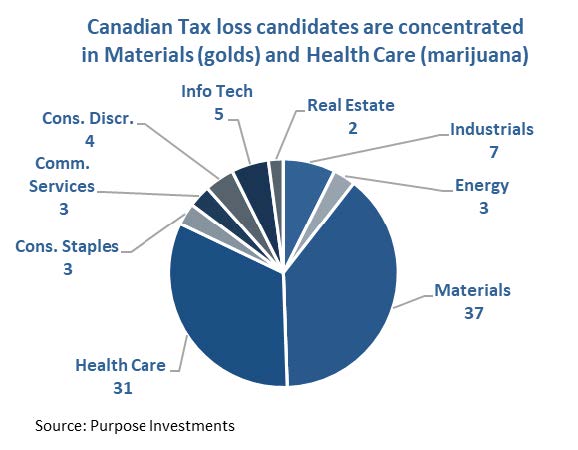
Looking through the list of companies with a market cap over $100m that are down over 20% from their average two-year price, what jumps out is that most of the prime tax-loss candidates are small cap companies and those clustered within a few select industries. Out of 95 companies, the average market cap was $652 million and just 11 have a current market cap of over $1 billion. Of those, half are cannabis companies, and the remainder is made up largely of precious metal companies. In total as seen in the chart below, weed and gold companies make up the overwhelming majority of the tax-loss candidates list. Recent performance of our prime candidates also supports the idea that they have been facing elevated selling pressure. The average one-month performance as of November 23, 2021, was -12% compared with the Toronto Stock Exchange at -1%.
Investment implications
The market is made up of a whole bunch of individuals making a whole bunch of decisions for a whole bunch of different reasons. It is this ‘mob’ that then influences the price of stocks, bonds, etc. Attempting to ascertain the mood or next move of this crowd is near impossible, except in unique situations such as tax-loss selling time. Taxes distort behaviour. This time of year, that distortion is likely heightened selling pressure on tax-loss candidates. And where there is a distortion, there is an opportunity.
This distortion can be seen in small caps. Fact is a large cap company, say Barrick, that is a tax-loss candidate probably won’t see its price pushed around too much because of some tax-motivated sellers. It’s too big and too liquid. As you move down the size spectrum and liquidity becomes scarcer, the impact of motivated sellers become more notable. This can be seen in the relative performance of small cap vs large cap. Over the past 20 years, small-cap underperformance relative to the TSX 60 begins in September and carries though to the beginning of December. From then, when the selling pressure begins to abate small caps have historically enjoyed a period of strong relative outperformance until around mid-February.
The seasonal aspect of this trade creates an interesting opportunity to specifically target companies that are facing undue selling pressure that leads to mis-priced assets or stocks. Assuming the market is at least semi-efficient once the tax-loss selling pressure abates these tax-loss candidates can gain back some of their lost ground. Of course, other influences may overwhelm this tax-loss selling price distortion, but that is why it is called investing. All else equal, the tax-loss selling candidates of today may enjoy a rebound once this tax-motivated selling pressure ends.
Charts are sourced to Bloomberg L.P. unless otherwise noted.
The contents of this publication were researched, written and produced by Richardson Wealth Limited and are used herein under a non-exclusive license by Echelon Wealth Partners Inc. (“Echelon”) for information purposes only. The statements and statistics contained herein are based on material believed to be reliable but there is no guarantee they are accurate or complete. Particular investments or trading strategies should be evaluated relative to each individual's objectives in consultation with their Echelon representative.
Forward Looking Statements
Forward-looking statements are based on current expectations, estimates, forecasts and projections based on beliefs and assumptions made by author. These statements involve risks and uncertainties and are not guarantees of future performance or results and no assurance can be given that these estimates and expectations will prove to have been correct, and actual outcomes and results may differ materially from what is expressed, implied or projected in such forward-looking statements.
The opinions expressed in this report are the opinions of the author and readers should not assume they reflect the opinions or recommendations of Echelon Wealth Partners Inc. or its affiliates. Assumptions, opinions and estimates constitute the author’s judgment as of the date of this material and are subject to change without notice. We do not warrant the completeness or accuracy of this material, and it should not be relied upon as such. Before acting on any recommendation, you should consider whether it is suitable for your particular circumstances and, if necessary, seek professional advice. Past performance is not indicative of future results. These estimates and expectations involve risks and uncertainties and are not guarantees of future performance or results and no assurance can be given that these estimates and expectations will prove to have been correct, and actual outcomes and results may differ materially from what is expressed, implied or projected in such forward-looking statements.
The particulars contained herein were obtained from sources which we believe are reliable, but are not guaranteed by us and may be incomplete. The information contained has not been approved by and are not those of Echelon Wealth Partners Inc. (“Echelon”), its subsidiaries, affiliates, or divisions including but not limited to Chevron Wealth Preservation Inc. This is not an official publication or research report of Echelon, the author is not an Echelon research analyst and this is not to be used as a solicitation in a jurisdiction where this Echelon representative is not registered.
The opinions expressed in this report are the opinions of its author, Richardson Wealth Limited (“Richardson”), used under a non-exclusive license and readers should not assume they reflect the opinions or recommendations of Echelon Wealth Partners Inc. (“Echelon”) or its affiliates.
This is not an official publication or research report of Echelon, the author is not an Echelon research analyst and this is not to be used as a solicitation in a jurisdiction where this Echelon representative is not registered. The information contained has not been approved by and are not those of Echelon, its subsidiaries, affiliates, or divisions including but not limited to Chevron Wealth Preservation Inc. The particulars contained herein were obtained from sources which we believe are reliable, but are not guaranteed by us and may be incomplete.
Assumptions, opinions and estimates constitute the author’s judgment as of the date of this material and are subject to change without notice. Echelon and Richardson do not warrant the completeness or accuracy of this material, and it should not be relied upon as such. Before acting on any recommendation, you should consider whether it is suitable for your particular circumstances and, if necessary, seek professional advice. Past performance is not indicative of future results. These estimates and expectations involve risks and uncertainties and are not guarantees of future performance or results and no assurance can be given that these estimates and expectations will prove to have been correct, and actual outcomes and results may differ materially from what is expressed, implied or projected in such forward-looking statements.
Forward-looking statements are based on current expectations, estimates, forecasts and projections based on beliefs and assumptions made by author. These statements involve risks and uncertainties and are not guarantees of future performance or results and no assurance can be given that these estimates and expectations will prove to have been correct, and actual outcomes and results may differ materially from what is expressed, implied or projected in such forward-looking statements.