Okay, even an armchair economist knew that used car prices, airfares, and car rentals couldn’t continue to go up by double digits month after month for very long.
These were some of the bigger contributing categories to the spike in the U.S. Consumer Price Index (CPI), the favoured measure for price inflation. In part because of compositional differences, the spike in Canada’s CPI has been less pronounced. Nonetheless, in June, the U.S. CPI was +5.4%—the highest since the early 1990s—and Canada CPI touched +4.1% in August, its highest in two decades.
During this run up of inflation, the common narrative has been this is “transitory.” And rightly so, since that has been the chorus line from the Federal Reserve, other central banks, and just about every economist. These price spikes have been caused by a combination of supply chain issues, abruptly changing consumer habits, strong demand, or if you prefer, the rippling effects from the pandemic. Airlines are a good example. They are accustomed to managing changing demand swings in the single digits, not a 50% decline in demand then a 50% recovery. Good luck staffing and managing a complex business to meet those swings.
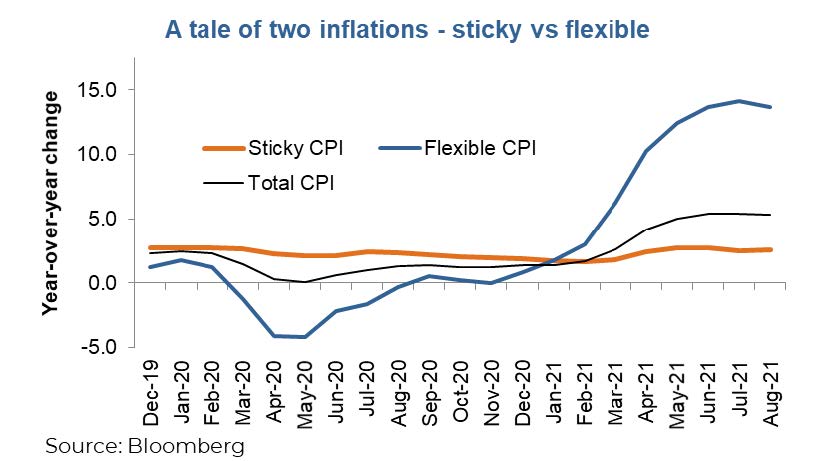
August U.S. CPI data showed that these transitory components of CPI are starting to come back down, or at the very least have stopped their ascent. Airline fares dropped 9% and car & truck rentals prices fell by 8% compared with the previous month. However, some still rose, and many remained elevated. Perhaps a more insightful framework for any longer-term impacts of this inflation spike is Atlanta Fed’s “Sticky” vs “Flexible” CPI measures. This separates CPI components based on how quickly the prices change in certain categories. For instance, airfares change really fast, home rent rates much less so.
As you can see in the chart below, total CPI has risen (as indicated by the thin black line), which has been almost entirely driven by the flexible component. Also, worth noting it was the flexible CPI categories that drove the deflationary pressures during the early days of the pandemic.
Supply chains will adjust as demand trends become more normalized or stable, which should help drive those flexible CPI categories back down. It is possible we have already started this process. If so, the much-anticipated decline in inflation may have started, driven by those flexible CPI components. Given central banks did not react to the upward spike—continuously calling it transitory—nor should they react to the backside of the inflation spike.
Inflation Is a Mindset
But this is all headline data for inflation, the real economic danger from inflation occurs when it changes behaviours. This can be a companies’ decisions to expand, individuals’ decisions on buying goods/services, employment, people’s savings patterns and of course investing choices. So far there hasn’t been much evidence of this, but it appears to be rising.
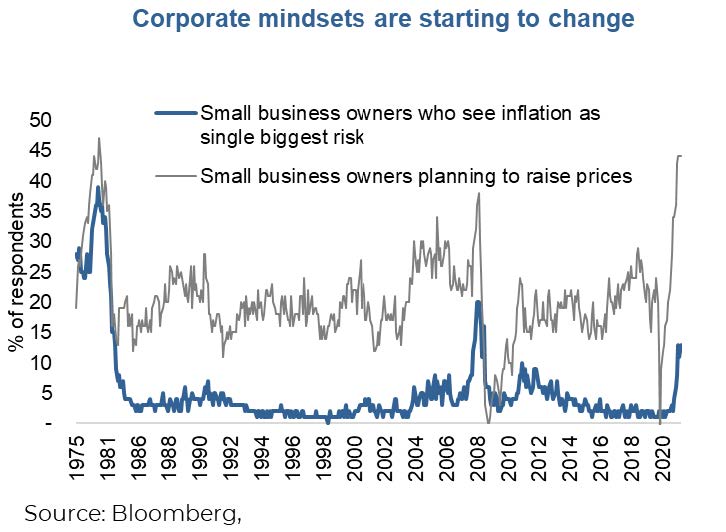
The National Federation of Independent Business surveys of small businesses say inflation is increasingly becoming a concern. The fear is nowhere near where it was in the 1970s (see chart right) but it’s certainly a rising risk in the eyes of entrepreneurs. Inflation raises uncertainty about the cost of projects, initiatives, and even steady state operations. A company could easily decide not to expand given inflation uncertainties, which has obvious broader economic implications.
Changing corporate mindsets are also evident in earnings transcripts. Mentions of rising inflationary costs were very prevalent in earnings conference calls during the Q2 earnings season, and for good reason. So far, rising top line revenue has kept up or largely surpassed rising costs, driven by the recovery plus companies raising their prices. This has kept margins high and healthy. If revenue growth slows, as is forecast, rising inflationary costs at the corporate level could quickly take a bite out of margins. We believe this will become a hot topic in the months ahead and investors should tilt more towards companies able to pass through rising costs or are less at risk.
Inflation is also a tax, especially for individuals as we can’t really pass through inflation like many corporations do. Let’s say your household enjoys an income of $250k, or $150k after tax (forgive us, we are generalizing). If inflation is rising at 5%, your after-tax & inflation household income would drop to about $130k after three years. Well, that sucks. Your options are then to demand a raise or switch jobs, just to keep up with inflation. This is the risk.
We all agree that much of the spike of inflation is transitory and as supply/demand balances get sorted out, this spike should come back down. However, behaviours are starting to change. This could cause the new base rate inflation to be higher than it has been for the past decade—especially if we start to see some rising price pressures in those sticky categories of CPI (remember the first chart).
Rent is a big component of CPI and certainly is in the sticky category. In fact, historically, we have not seen sustained higher inflation without rent being a contributor. And while wages are not explicitly a category of CPI, wages flow through to the end price in most industries. Wages are also very sticky: have you ever tried to tell someone you will be paying them less? Really doesn’t go over well.
Investment Implications
As the flexible CPI components stubbornly fall back to earth, the narrative around inflation may turn quieter. However, mindsets are starting to change, and those sticky CPI components are stirring a bit higher. With rising wages, inflation and cost pressures on corporate earnings are likely to become a topic for the coming year. The recipe for runaway inflation remains absent; however, a higher inflationary environment compared with the past decade appears likely. This could have impacts on yields, valuations, style, and margins. For now, keep a keen eye on rents and wages to see if this inflation spike is going to grow into a longer-term issue.
Charts are sourced to Bloomberg L.P. unless otherwise noted.
The contents of this publication were researched, written and produced by Purpose Investments Inc. and are used by Echelon Wealth Partners Inc. for information purposes only.
This report is authored by Craig Basinger, Chief Market Strategist, Purpose Investments Inc.
Forward Looking Statements
Forward-looking statements are based on current expectations, estimates, forecasts and projections based on beliefs and assumptions made by author. These statements involve risks and uncertainties and are not guarantees of future performance or results and no assurance can be given that these estimates and expectations will prove to have been correct, and actual outcomes and results may differ materially from what is expressed, implied or projected in such forward-looking statements.
The opinions expressed in this report are the opinions of the author and readers should not assume they reflect the opinions or recommendations of Echelon Wealth Partners Inc. or its affiliates. Assumptions, opinions and estimates constitute the author’s judgment as of the date of this material and are subject to change without notice. We do not warrant the completeness or accuracy of this material, and it should not be relied upon as such. Before acting on any recommendation, you should consider whether it is suitable for your particular circumstances and, if necessary, seek professional advice. Past performance is not indicative of future results. These estimates and expectations involve risks and uncertainties and are not guarantees of future performance or results and no assurance can be given that these estimates and expectations will prove to have been correct, and actual outcomes and results may differ materially from what is expressed, implied or projected in such forward-looking statements.
The particulars contained herein were obtained from sources which we believe are reliable, but are not guaranteed by us and may be incomplete. The information contained has not been approved by and are not those of Echelon Wealth Partners Inc. (“Echelon”), its subsidiaries, affiliates, or divisions including but not limited to Chevron Wealth Preservation Inc. This is not an official publication or research report of Echelon, the author is not an Echelon research analyst and this is not to be used as a solicitation in a jurisdiction where this Echelon representative is not registered.
The opinions expressed in this report are the opinions of its author, Richardson Wealth Limited (“Richardson”), used under a non-exclusive license and readers should not assume they reflect the opinions or recommendations of Echelon Wealth Partners Inc. (“Echelon”) or its affiliates.
This is not an official publication or research report of Echelon, the author is not an Echelon research analyst and this is not to be used as a solicitation in a jurisdiction where this Echelon representative is not registered. The information contained has not been approved by and are not those of Echelon, its subsidiaries, affiliates, or divisions including but not limited to Chevron Wealth Preservation Inc. The particulars contained herein were obtained from sources which we believe are reliable, but are not guaranteed by us and may be incomplete.
Assumptions, opinions and estimates constitute the author’s judgment as of the date of this material and are subject to change without notice. Echelon and Richardson do not warrant the completeness or accuracy of this material, and it should not be relied upon as such. Before acting on any recommendation, you should consider whether it is suitable for your particular circumstances and, if necessary, seek professional advice. Past performance is not indicative of future results. These estimates and expectations involve risks and uncertainties and are not guarantees of future performance or results and no assurance can be given that these estimates and expectations will prove to have been correct, and actual outcomes and results may differ materially from what is expressed, implied or projected in such forward-looking statements.
Forward-looking statements are based on current expectations, estimates, forecasts and projections based on beliefs and assumptions made by author. These statements involve risks and uncertainties and are not guarantees of future performance or results and no assurance can be given that these estimates and expectations will prove to have been correct, and actual outcomes and results may differ materially from what is expressed, implied or projected in such forward-looking statements.