Modern Portfolio Theory (MPT) sits at the core of just about every portfolio construction process.
While developed some seventy years ago, the core beliefs of MPT remain as applicable today as they did before. Combining various asset classes that have different return and volatility characteristics, a portfolio can be constructed to target an expected return given an appropriate level of risk (volatility). More recently, say the last 25 years, this approach has been at the core of proportionately combining equities and bonds to achieve different portfolios to suit various investor needs and objectives. And to put it frankly, this has worked very well helping many investors reach their goals.
However, MPT may have a problem going forward. Don’t worry we are not going to hack on bonds based on a fear that yields may rise in the future, creating a portfolio drag. There are already enough bond haters out there. The issue we are seeing goes beyond just the bond argument, correlations have been rising just about everywhere. In today’s world correlations have been changing with more and more asset classes are becoming increasingly correlated. The problem then becomes, if the correlations between investments are higher, it becomes harder to diversify risk in a portfolio.
Let’s start with the big one, global bonds and global equities. Combining equities and bonds have benefited from a generally negative correlation for much of the past few decades. However, this correlation has turned positive of late (chart 1), implying reduced diversification benefits when combining bonds and equities. This isn’t too much of a concern given the long-term average is slightly positive.
But don’t throw out your bonds just yet. This correlation tends to return to be strongly negative during risk-off periods in the equity markets. This reflex action during corrections helps maintain bonds in portfolios, even if they experience periods of low or even negative performance.
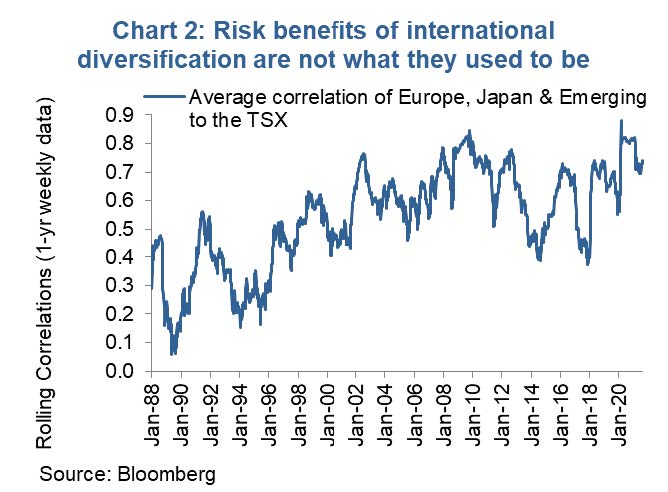
Rising correlations go beyond just bonds and equities. Equities themselves have become increasingly correlated. This can be seen in the rolling correlation between international equity markets. International equity diversification used to be a powerful risk reduction strategy. Getting exposure to equity markets that are comprised of different companies and sector mixes, exposed to different economic and interest rate regimes. But in a world that has become more and more interconnected, whether by communications, economically or by group think among central banks, global equity markets are moving as one. (chart 2).
We are not suggesting investors shy away from international diversification. Truth be told, most Canadian investors suffer from home country bias and could use more international exposure. Other markets still offer different return profiles. However, the risk benefits are not what they used to be.
Even within equity markets such as the S&P 500, diversification benefits are muted. Chart 3 is the average divergence over six months of the best and worst performing sectors. This helps reveal the degree of variation between different sectors over time. When all sectors are moving closer together, the benefits of diversification even with one equity market are muted.
Similar rising correlations compared to equities can be seen in commodity markets, alternatives, the list goes on. Correlations appear to be higher.
Investment Implications
Diversification remains at the core of portfolio construction. However, in markets dominated by major factors such as pandemics, previously unheard-of monetary influences, fiscal spending with few limitations,
the macro rules the roost. This has changed historic correlations and relationships between asset classes. While they may change back as the world moves back to whatever normal is going to be, in the meantime finding effective diversification strategies for portfolios will be at a premium.
The success of the ‘buy any dip’ strategy has likely strengthened the resolve of investors who will view any weakness as a buying opportunity. Perhaps that is the reason the market has been steadily rising for six months with pullbacks maxing out in the low single digits (Chart 4). Certainly this is creating a pleasant investment environment; hope you are all enjoying it. Yet often the longer a period of tranquility, the bigger the inevitable shakeout.
Chart 4: S&PO 500, such a smooth ride for the past 6-months
Conclusion
Whether we look at aggregate fund flows or the tactical shifts in asset allocation among the high net worth, investors did a better job than normal during the 2020 bear market compared to past periods of market turmoil. Yes, the wealthier investors did an even better job – then again, maybe that is why they are wealthier. However, that is a much longer and very debatable topic.
Charts are sourced to Bloomberg L.P. unless otherwise noted.
The contents of this publication were researched, written and produced by Richardson Wealth Limited and are used herein under a non-exclusive license by Echelon Wealth Partners Inc. (“Echelon”) for information purposes only. The statements and statistics contained herein are based on material believed to be reliable but there is no guarantee they are accurate or complete. Particular investments or trading strategies should be evaluated relative to each individual's objectives in consultation with their Echelon representative.
Forward Looking Statements
Forward-looking statements are based on current expectations, estimates, forecasts and projections based on beliefs and assumptions made by author. These statements involve risks and uncertainties and are not guarantees of future performance or results and no assurance can be given that these estimates and expectations will prove to have been correct, and actual outcomes and results may differ materially from what is expressed, implied or projected in such forward-looking statements.
The opinions expressed in this report are the opinions of the author and readers should not assume they reflect the opinions or recommendations of Echelon Wealth Partners Inc. or its affiliates. Assumptions, opinions and estimates constitute the author’s judgment as of the date of this material and are subject to change without notice. We do not warrant the completeness or accuracy of this material, and it should not be relied upon as such. Before acting on any recommendation, you should consider whether it is suitable for your particular circumstances and, if necessary, seek professional advice. Past performance is not indicative of future results. These estimates and expectations involve risks and uncertainties and are not guarantees of future performance or results and no assurance can be given that these estimates and expectations will prove to have been correct, and actual outcomes and results may differ materially from what is expressed, implied or projected in such forward-looking statements.
The particulars contained herein were obtained from sources which we believe are reliable, but are not guaranteed by us and may be incomplete. The information contained has not been approved by and are not those of Echelon Wealth Partners Inc. (“Echelon”), its subsidiaries, affiliates, or divisions including but not limited to Chevron Wealth Preservation Inc. This is not an official publication or research report of Echelon, the author is not an Echelon research analyst and this is not to be used as a solicitation in a jurisdiction where this Echelon representative is not registered.
The opinions expressed in this report are the opinions of its author, Richardson Wealth Limited (“Richardson”), used under a non-exclusive license and readers should not assume they reflect the opinions or recommendations of Echelon Wealth Partners Inc. (“Echelon”) or its affiliates.
This is not an official publication or research report of Echelon, the author is not an Echelon research analyst and this is not to be used as a solicitation in a jurisdiction where this Echelon representative is not registered. The information contained has not been approved by and are not those of Echelon, its subsidiaries, affiliates, or divisions including but not limited to Chevron Wealth Preservation Inc. The particulars contained herein were obtained from sources which we believe are reliable, but are not guaranteed by us and may be incomplete.
Assumptions, opinions and estimates constitute the author’s judgment as of the date of this material and are subject to change without notice. Echelon and Richardson do not warrant the completeness or accuracy of this material, and it should not be relied upon as such. Before acting on any recommendation, you should consider whether it is suitable for your particular circumstances and, if necessary, seek professional advice. Past performance is not indicative of future results. These estimates and expectations involve risks and uncertainties and are not guarantees of future performance or results and no assurance can be given that these estimates and expectations will prove to have been correct, and actual outcomes and results may differ materially from what is expressed, implied or projected in such forward-looking statements.
Forward-looking statements are based on current expectations, estimates, forecasts and projections based on beliefs and assumptions made by author. These statements involve risks and uncertainties and are not guarantees of future performance or results and no assurance can be given that these estimates and expectations will prove to have been correct, and actual outcomes and results may differ materially from what is expressed, implied or projected in such forward-looking statements.