Everyone continues to discuss what the new normal is going to look like as the pandemic restrictions are gradually lifted (fingers crossed). Well, there is nothing normal about the markets at the moment. Despite being less than a year out of a supposed bear market, index levels are at all-time highs along with valuations at decade-long highs, while the economy continues to gradually recover and unemployment remains elevated. Speculative behaviour is rampant whether you look at IPOs/SPACs, niche industries, crypto, thematic ETFs, the list goes on. Adding to this are the new platforms, like Reddit, which crowd into one investment then move onto another.
Money that flows into or out of an asset class, sector or individual company matters, sometimes a lot. Consider the fact that apart from initial or secondary public offerings or option-related issuance from a government treasury, the number of shares available for purchase in a given company is relatively stable. We are simplifying things here, but if a group of new investors, perhaps Reddit followers who just received a fresh cheque (or check) from their new President, decide to put some money into “ABC Co.”, all else being equal, the share price will rise. It will rise until enough pre-existing or new investors decide that they are willing to sell their shares given the new price. Of course, this works in both directions.
Chart 1 depicts a number of companies, and one commodity, that witnessed a social media-induced rush of investors. Note the various changes in price and duration before falling back to previous levels. Those companies that had pre-existing sizeable short positions, a narrower investor base – essentially the smaller companies – experienced a bigger impact from this thrust of new investors. In some cases, this impact lasted for days or over a week+. Contrast this with Nokia, a widely held global telecom company that saw its share price jump for one day; or silver, a much bigger market than all the companies in the chart combined, which barely budged. All of these provide mini examples demonstrating the importance of money flow given an investments liquidity or size.
Looking at the bigger picture, we can see fund flows in other ways. ETF issuance provides a glimpse into the changing flow in and out of ETFs. Keep in mind there is a multi-decades migration afoot from traditional fund structures to ETFs, but you can see acceleration and deceleration of flows. Over the past few months and accelerating into 2021, we are witnessing faster inflow into equity ETFs (green bars). This inflow is in part helping the market handle bad news and not react negatively. Soft economic data, riots in early January, COVID cases, all seem to have no impact on equities. Of course, there is good news out there too, but these flows help on the margin.
Naturally, a few billion of inflows or outflows won’t move the overall market very much just based on its size; think of the Reddit crowd and the silver market. However, one interesting development over the past year is the rise of thematic ETFs. These are the baskets of securities attempting to capture the attention of a certain theme: electric cars, cyber security, 5G, the cloud, e-gaming—take your pick.
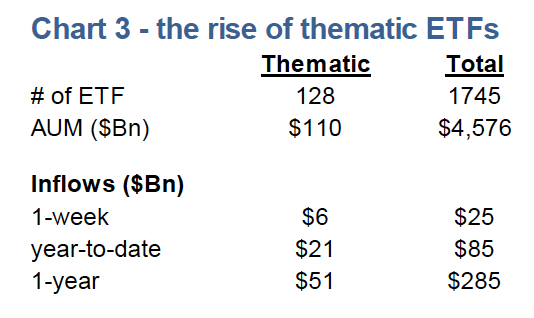
This is where things get interesting. Remember flows are most impactful when the market is smaller or less liquid. These thematic ETFs, which are often based on just a handful of companies and in some cases the liquidity of those companies are on the lighter side, have been receiving massive inflows. So far in 2021, U.S. equity- listed ETFs have seen $85 billion in inflows. Within this number, $21 billion has been channelled into thematic ETFs. Keep in mind that U.S. equity ETF total assets sit at about $4.6 trillion while the thematic ETF total assets sit at $110 billion.
We are fans of ETFs, and manage three of them. However, we are aware that passive ETFs piggyback on the work of active management. If the price of an asset is too high, active managers will sell; or they will buy if sufficiently low—this results in a more efficiently priced asset. Passive ETFs can then offer the index or a basket, comprised of supposedly efficiently priced assets thanks to active managers, at a cheaper price point (lower fee). But the migration to more ETFs has resulted in less active management in the market and likely less efficient pricing.
When you factor in this secular change to the market participant mix, combined with the sizeable inflows into thematic ETFs – which are comprised of many companies that are not very liquid or widely held – it’s likely that there is lots of mispricing going on. We are not saying you shouldn’t love the prospect of sitting in the back of your electric car using your 5G phone to participate in an online Madden football tournament hosted on the cloud. We are saying these flows are likely leading to some asset mispricing.
Investment Implications
Thematic investing is not going away, it is an efficient way to gain access to a key theme and can add a bit of flare to a portfolio. Just be aware that in these pockets there is an elevated chance of assets being mispriced due to the recent inflows.
Charts are sourced to Bloomberg L.P. unless otherwise noted.
The contents of this publication were researched, written and produced by Richardson Wealth Limited and are used herein under a non-exclusive license by Echelon Wealth Partners Inc. (“Echelon”) for information purposes only. The statements and statistics contained herein are based on material believed to be reliable but there is no guarantee they are accurate or complete. Particular investments or trading strategies should be evaluated relative to each individual's objectives in consultation with their Echelon representative.
Forward Looking Statements
Forward-looking statements are based on current expectations, estimates, forecasts and projections based on beliefs and assumptions made by author. These statements involve risks and uncertainties and are not guarantees of future performance or results and no assurance can be given that these estimates and expectations will prove to have been correct, and actual outcomes and results may differ materially from what is expressed, implied or projected in such forward-looking statements.
The opinions expressed in this report are the opinions of the author and readers should not assume they reflect the opinions or recommendations of Echelon Wealth Partners Inc. or its affiliates. Assumptions, opinions and estimates constitute the author’s judgment as of the date of this material and are subject to change without notice. We do not warrant the completeness or accuracy of this material, and it should not be relied upon as such. Before acting on any recommendation, you should consider whether it is suitable for your particular circumstances and, if necessary, seek professional advice. Past performance is not indicative of future results. These estimates and expectations involve risks and uncertainties and are not guarantees of future performance or results and no assurance can be given that these estimates and expectations will prove to have been correct, and actual outcomes and results may differ materially from what is expressed, implied or projected in such forward-looking statements.
The particulars contained herein were obtained from sources which we believe are reliable, but are not guaranteed by us and may be incomplete. The information contained has not been approved by and are not those of Echelon Wealth Partners Inc. (“Echelon”), its subsidiaries, affiliates, or divisions including but not limited to Chevron Wealth Preservation Inc. This is not an official publication or research report of Echelon, the author is not an Echelon research analyst and this is not to be used as a solicitation in a jurisdiction where this Echelon representative is not registered.
The opinions expressed in this report are the opinions of its author, Richardson Wealth Limited (“Richardson”), used under a non-exclusive license and readers should not assume they reflect the opinions or recommendations of Echelon Wealth Partners Inc. (“Echelon”) or its affiliates.
This is not an official publication or research report of Echelon, the author is not an Echelon research analyst and this is not to be used as a solicitation in a jurisdiction where this Echelon representative is not registered. The information contained has not been approved by and are not those of Echelon, its subsidiaries, affiliates, or divisions including but not limited to Chevron Wealth Preservation Inc. The particulars contained herein were obtained from sources which we believe are reliable, but are not guaranteed by us and may be incomplete.
Assumptions, opinions and estimates constitute the author’s judgment as of the date of this material and are subject to change without notice. Echelon and Richardson do not warrant the completeness or accuracy of this material, and it should not be relied upon as such. Before acting on any recommendation, you should consider whether it is suitable for your particular circumstances and, if necessary, seek professional advice. Past performance is not indicative of future results. These estimates and expectations involve risks and uncertainties and are not guarantees of future performance or results and no assurance can be given that these estimates and expectations will prove to have been correct, and actual outcomes and results may differ materially from what is expressed, implied or projected in such forward-looking statements.
Forward-looking statements are based on current expectations, estimates, forecasts and projections based on beliefs and assumptions made by author. These statements involve risks and uncertainties and are not guarantees of future performance or results and no assurance can be given that these estimates and expectations will prove to have been correct, and actual outcomes and results may differ materially from what is expressed, implied or projected in such forward-looking statements.