Dividend-focused investing is at the core of most Canadian investors’ portfolios, and for good reason. As bond yields grinded lower for much of the past 40 years, the quest for other sources of cash flow fed a steady stream of investors and capital into dividend-paying equities. And it has been a relatively pleasant ride, as this portion of the market has historically enjoyed good returns and less volatility than the overall TSX (a strong combo). Throw on some preferential tax treatment and we continue to believe dividend-paying equities should remain at the core of most portfolios.
However, dividend investing is becoming more challenging than decades past. Most, us included, believe bond yields may have bottomed and are poised to rise in the near term as the global economy emerges from this pandemic. This shorter-term cyclical rise may be followed by rising inflationary pressures in the medium to longer term (Crying wolf on inflation, again?). We are not expecting a huge rise in yields but see them climbing, nonetheless. And for dividend investors, this matters as some companies are more or less sensitive to changing yields in the bond market.
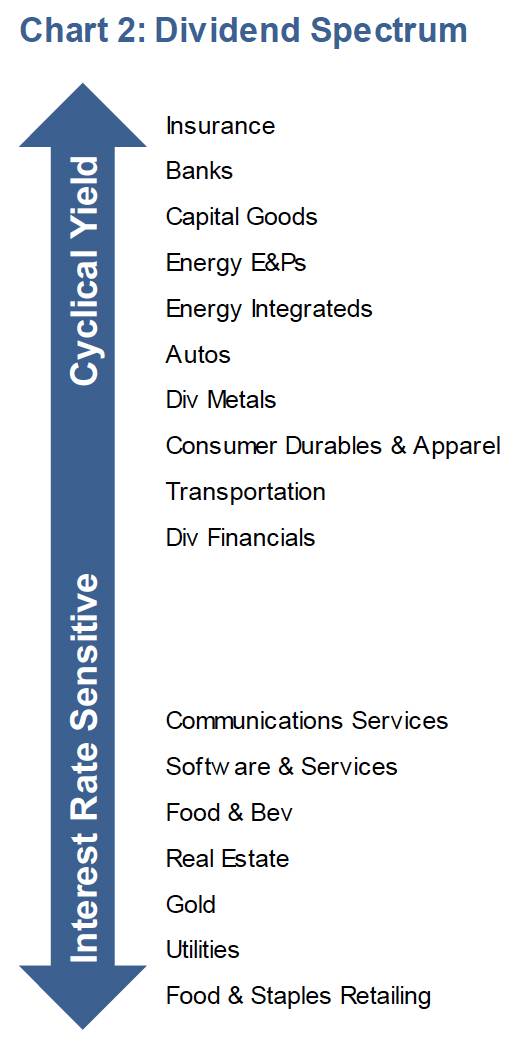
Our scoring or ranking system uses a combination of an industry’s correlation to bond yields, sensitivity to bond yields (think like Beta but instead of relative to the market it’s relative to yields) and an out-of-sample score for periods over the past decade of rising yields. Chart 2 depicts the scoring of a number of key sectors/industries within the TSX. The top grouping, Cyclical Yield, are those that we would expect to hold up better in a rising yield environment. The bottom grouping, Interest Rate Sensitive, are those that we would expect to perform best in a falling yield environment.
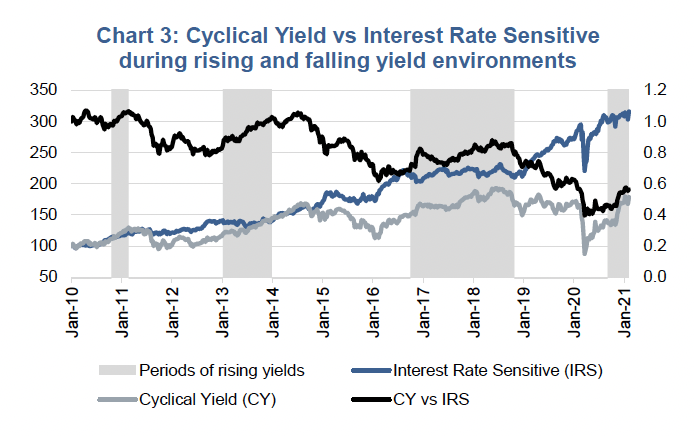
Chart 3 compares the performance of the Cyclical Yield versus Interest Rate Sensitive industries over the past decade. Cyclical Yield is outperforming when the black relative line is rising and underperforming when falling. The grey shaded areas are periods of rising bond yields.
Investment Implications
If bond yields have started an extended trend higher (this does remain a big ‘If”), dividend strategies will have a tougher go than years past; specifically, those that are more heavily weighted towards interest rate-sensitive sectors or industries. We believe for dividend managers, tilting increasingly towards cyclical yield names and industries will help reduce this interest rate risk. However, it does come at a cost. If the economy falters, the cyclical yield names are certainly not the best place to be.
Much with all investing, it depends on what happens next. Currently we believe the probability is for higher rising yields and would recommend investors increase their exposure to cyclical yield over interest-rate sensitivities within their dividend portfolios.
Charts are sourced to Bloomberg L.P. unless otherwise noted.
The contents of this publication were researched, written and produced by Richardson Wealth Limited and are used herein under a non-exclusive license by Echelon Wealth Partners Inc. (“Echelon”) for information purposes only. The statements and statistics contained herein are based on material believed to be reliable but there is no guarantee they are accurate or complete. Particular investments or trading strategies should be evaluated relative to each individual's objectives in consultation with their Echelon representative.
Forward Looking Statements
Forward-looking statements are based on current expectations, estimates, forecasts and projections based on beliefs and assumptions made by author. These statements involve risks and uncertainties and are not guarantees of future performance or results and no assurance can be given that these estimates and expectations will prove to have been correct, and actual outcomes and results may differ materially from what is expressed, implied or projected in such forward-looking statements.
The opinions expressed in this report are the opinions of the author and readers should not assume they reflect the opinions or recommendations of Echelon Wealth Partners Inc. or its affiliates. Assumptions, opinions and estimates constitute the author’s judgment as of the date of this material and are subject to change without notice. We do not warrant the completeness or accuracy of this material, and it should not be relied upon as such. Before acting on any recommendation, you should consider whether it is suitable for your particular circumstances and, if necessary, seek professional advice. Past performance is not indicative of future results. These estimates and expectations involve risks and uncertainties and are not guarantees of future performance or results and no assurance can be given that these estimates and expectations will prove to have been correct, and actual outcomes and results may differ materially from what is expressed, implied or projected in such forward-looking statements.
The particulars contained herein were obtained from sources which we believe are reliable, but are not guaranteed by us and may be incomplete. The information contained has not been approved by and are not those of Echelon Wealth Partners Inc. (“Echelon”), its subsidiaries, affiliates, or divisions including but not limited to Chevron Wealth Preservation Inc. This is not an official publication or research report of Echelon, the author is not an Echelon research analyst and this is not to be used as a solicitation in a jurisdiction where this Echelon representative is not registered.
The opinions expressed in this report are the opinions of its author, Richardson Wealth Limited (“Richardson”), used under a non-exclusive license and readers should not assume they reflect the opinions or recommendations of Echelon Wealth Partners Inc. (“Echelon”) or its affiliates.
This is not an official publication or research report of Echelon, the author is not an Echelon research analyst and this is not to be used as a solicitation in a jurisdiction where this Echelon representative is not registered. The information contained has not been approved by and are not those of Echelon, its subsidiaries, affiliates, or divisions including but not limited to Chevron Wealth Preservation Inc. The particulars contained herein were obtained from sources which we believe are reliable, but are not guaranteed by us and may be incomplete.
Assumptions, opinions and estimates constitute the author’s judgment as of the date of this material and are subject to change without notice. Echelon and Richardson do not warrant the completeness or accuracy of this material, and it should not be relied upon as such. Before acting on any recommendation, you should consider whether it is suitable for your particular circumstances and, if necessary, seek professional advice. Past performance is not indicative of future results. These estimates and expectations involve risks and uncertainties and are not guarantees of future performance or results and no assurance can be given that these estimates and expectations will prove to have been correct, and actual outcomes and results may differ materially from what is expressed, implied or projected in such forward-looking statements.
Forward-looking statements are based on current expectations, estimates, forecasts and projections based on beliefs and assumptions made by author. These statements involve risks and uncertainties and are not guarantees of future performance or results and no assurance can be given that these estimates and expectations will prove to have been correct, and actual outcomes and results may differ materially from what is expressed, implied or projected in such forward-looking statements.