Those four words are arguably responsible for more loss of capital than any other phrase. (Good old John Templeton!) The
phrase pops up all the time to explain or justify how the world has changed and those that don’t “get it” are the ones being naive. It was common during
the nifty-50 bubble in the 1970s (Xerox was set to take over the world), during the dot-com bubble of the 1990s (internet revolution) and when the U.S. Federal Reserve could use monetary policy to make recessions obsolete. While certainly these can be “dangerous” words when used to cajole the unsuspecting, markets are in fact always changing. They change because the behaviour of market participants changes. Whether the players are central bankers, active portfolio managers or a group of investors influenced by a crowd-sourcing platform, their actions constantly change and that alters how the markets function.
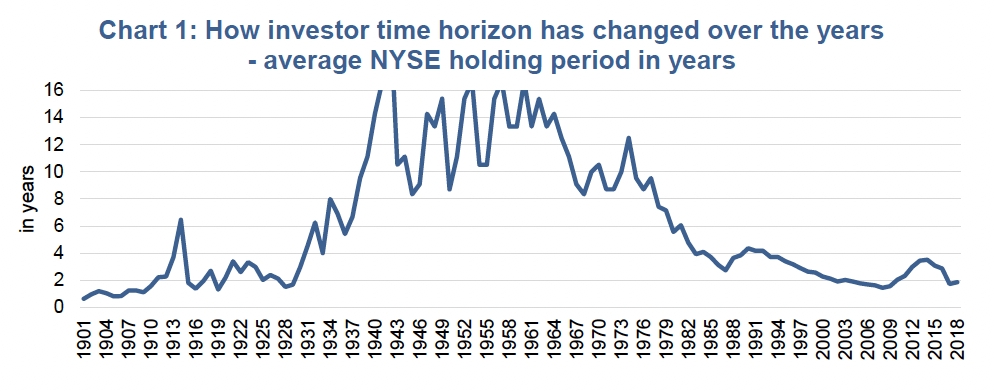
One of our favourite long-term charts on changing investor behaviour is the average holding period for New York Stock Exchange-listed (NYSE) stocks. This is simply the “average” amount of time an investor holds onto a given position (Chart 1). Yes, in the early 1900s, investors only stuck with a name for a year or two—similar to today. But from the 1930s to the 1970s, investors certainly opted for more of a buy-and-hold approach. Many things contributed to this change in behaviour, from technology, market composition and available strategies. Nonetheless, the average investor’s time horizon is certainly shorter.
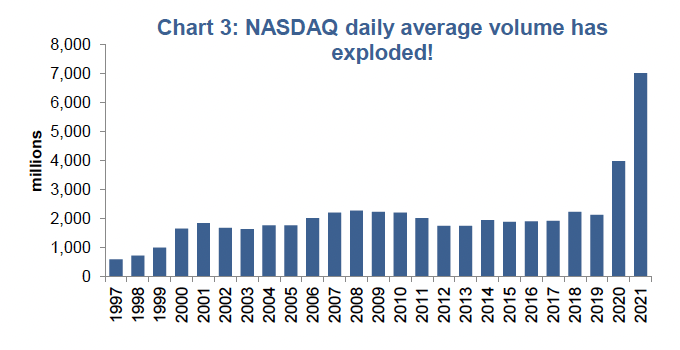
More recently, the rate of increase in trading volumes and activity has accelerated. In contrast, the average daily volume for the NYSE – which peaked in the early 2000s as high-frequency trading become more prevalent, subsided for much of the 2010s. Today, volumes are on the rise in the NYSE mega caps (Chart 2). This trend is much more pronounced in the more speculative markets/exchanges. Reports indicate that penny stock volumes, as a percentage of total volume, are at levels not seen since the late 1990s bubble. Volumes on the NASDAQ have not just entered uncharted territory, but have more than tripled previous records (Chart 3).
Investment Implications
It is fine to dabble in the more speculative corners of the market. There are times that returns in these areas can really provide a performance boost for a portfolio. And those times can go on for longer than many believe they will. Plus, it can be fun. Just make sure that as a percentage of the overall portfolio, speculative trading remains appropriately sized for your risk tolerance because these speculative frenzies do end. Xerox, in case you hadn’t noticed, didn’t take over the world. Amazon/Apple won’t either, nor will electric vehicle (EV) stocks.
[Note: the authors fully understand the network effect and the global will to fight climate change. We also understand the price paid for something is usually the biggest input into your future return].
Enjoy these times, this is one of the more interesting times to be an investor.
Charts are sourced to Bloomberg L.P. unless otherwise noted.
The contents of this publication were researched, written and produced by Richardson Wealth Limited and are used herein under a non-exclusive license by Echelon Wealth Partners Inc. (“Echelon”) for information purposes only. The statements and statistics contained herein are based on material believed to be reliable but there is no guarantee they are accurate or complete. Particular investments or trading strategies should be evaluated relative to each individual's objectives in consultation with their Echelon representative.
Forward Looking Statements
Forward-looking statements are based on current expectations, estimates, forecasts and projections based on beliefs and assumptions made by author. These statements involve risks and uncertainties and are not guarantees of future performance or results and no assurance can be given that these estimates and expectations will prove to have been correct, and actual outcomes and results may differ materially from what is expressed, implied or projected in such forward-looking statements.
The opinions expressed in this report are the opinions of the author and readers should not assume they reflect the opinions or recommendations of Echelon Wealth Partners Inc. or its affiliates. Assumptions, opinions and estimates constitute the author’s judgment as of the date of this material and are subject to change without notice. We do not warrant the completeness or accuracy of this material, and it should not be relied upon as such. Before acting on any recommendation, you should consider whether it is suitable for your particular circumstances and, if necessary, seek professional advice. Past performance is not indicative of future results. These estimates and expectations involve risks and uncertainties and are not guarantees of future performance or results and no assurance can be given that these estimates and expectations will prove to have been correct, and actual outcomes and results may differ materially from what is expressed, implied or projected in such forward-looking statements.
The particulars contained herein were obtained from sources which we believe are reliable, but are not guaranteed by us and may be incomplete. The information contained has not been approved by and are not those of Echelon Wealth Partners Inc. (“Echelon”), its subsidiaries, affiliates, or divisions including but not limited to Chevron Wealth Preservation Inc. This is not an official publication or research report of Echelon, the author is not an Echelon research analyst and this is not to be used as a solicitation in a jurisdiction where this Echelon representative is not registered.
The opinions expressed in this report are the opinions of its author, Richardson Wealth Limited (“Richardson”), used under a non-exclusive license and readers should not assume they reflect the opinions or recommendations of Echelon Wealth Partners Inc. (“Echelon”) or its affiliates.
This is not an official publication or research report of Echelon, the author is not an Echelon research analyst and this is not to be used as a solicitation in a jurisdiction where this Echelon representative is not registered. The information contained has not been approved by and are not those of Echelon, its subsidiaries, affiliates, or divisions including but not limited to Chevron Wealth Preservation Inc. The particulars contained herein were obtained from sources which we believe are reliable, but are not guaranteed by us and may be incomplete.
Assumptions, opinions and estimates constitute the author’s judgment as of the date of this material and are subject to change without notice. Echelon and Richardson do not warrant the completeness or accuracy of this material, and it should not be relied upon as such. Before acting on any recommendation, you should consider whether it is suitable for your particular circumstances and, if necessary, seek professional advice. Past performance is not indicative of future results. These estimates and expectations involve risks and uncertainties and are not guarantees of future performance or results and no assurance can be given that these estimates and expectations will prove to have been correct, and actual outcomes and results may differ materially from what is expressed, implied or projected in such forward-looking statements.
Forward-looking statements are based on current expectations, estimates, forecasts and projections based on beliefs and assumptions made by author. These statements involve risks and uncertainties and are not guarantees of future performance or results and no assurance can be given that these estimates and expectations will prove to have been correct, and actual outcomes and results may differ materially from what is expressed, implied or projected in such forward-looking statements.