At the heart of why most investors hold bonds in their portfolio, either directly or through a fund / ETF, is diversification. It certainly isn’t cashflow anymore, given equities yield more than many bonds and equity dividends enjoy better tax treatment. The market gyrations of holding 100% equity is simply too great for most and combining some bonds reduced the overall portfolio volatility. This diversification, of adding various asset classes, is at the heart of modern portfolio theory and how most portfolios have been constructed.
There is no denying the data in chart 1. From 1950 to present, adding a Canadian bond allocation to a portfolio comprised of Canadian and Global equities reduced the frequency of negative returns over various holding periods. In fact, a portfolio comprised of 60% equity and 40% bonds has not experienced a negative 5-year return period over the past 70 years. We acknowledge this is a simplification using index data, no tax and no transaction costs. Still, the diversification benefits of bonds appear very compelling.
A balanced 60/40 portfolio has delivered an 8.4% annualized return over the past 5-years. That is below the 11.9% from an all-equity portfolio but a much smoother experience with less chances of making an emotional allocation mistake. So why so much disdain over bonds and the traditional 60/40 portfolio of late? We believe two reasons: forward return expectations and correlations.
What Bonds Can Deliver – Return Expectations
Forecasting forward market returns is challenging to say the least. But for bonds forecasting return expectations are relatively easier than that of other asset classes. Temporarily ignoring corporate defaults or credit spread changes, the return for bonds boils down mainly to the current yield and changes in prevailing yields. Of course, this is the issue of late as bond yields were very low following the pandemic-driven recession and global government bond buying activity. The return expectations were very low if not negative. Over the past six months, we have seen yields rising and inflation expectations rising, putting downward pressure on the performance of bonds. Year-to-date, Canadian bonds are down about - 6%. Not a pleasant development for the portion of your portfolio designed to provide stability.
There is a silver lining to this. Unlike equities and many other asset classes, a price decline due to rising yields naturally increases the future expected return of bonds. Because yields are now higher. Bad news today is good news for bonds down the road. For example, the strong performance of bonds in the 1st half of 2020 till the summer (+7.4%), was the precursor for the bad news of late.
While we are not in the camp saying the near term upward move in yields is over (latest Investor Strategy HERE), these higher yields are and will
gradually become more interesting. But don’t forget, most bond allocations are primarily tasked with reducing overall portfolio volatility, which brings
up correlations.
Correlations – have turned positive
For an asset or investment to provide diversification when added to a portfolio, the correlation has to be less than 1. And the further the correlation is below 1 (ideally into negative territory) the better. This raises another concern for bond allocations of late, as the equity to bond correlation has be become positive (chart 2). The negative correlation from 2002-2015 was a great time for bonds as a diversification tool. The rolling correlation moved back to the historical average from 2016-2019 and has since become positive in 2020+. Does this mean bonds are not a useful diversification ingredient for portfolios in today’s environment? Not so fast.
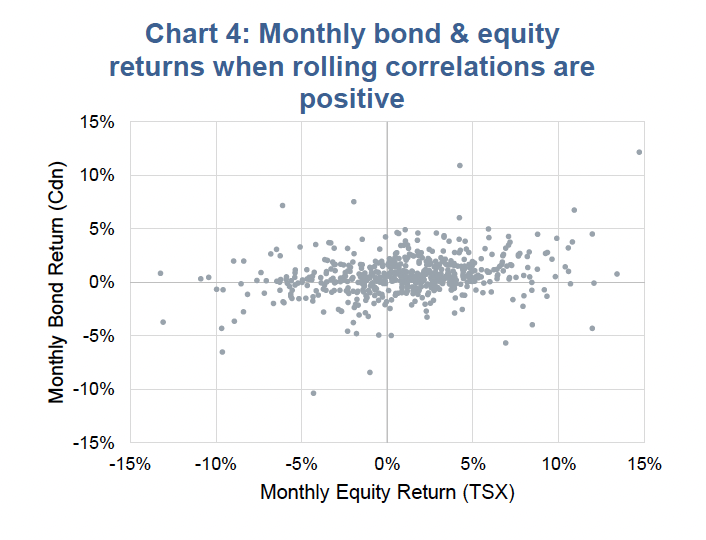
Chart 3 is a scatter plot of all monthly returns for Canadian bonds and Canadian equities since 1950. Looks just like a random pile of dots spread out more horizontally than vertically, no? That’s because the variance of monthly returns is much greater for equities than bonds. Importantly, the cluster is not diagonal from the bottom left to the top right. That would be a poor diversification investment. Chart 4 is the same data but only months when the 3-year rolling correlation between equities and bonds was positive. It’s a similar distribution, which means there is still diversification benefits to bonds.
Even more important, during periods when equities and bonds were positively correlated and one could be doubting the diversification benefits of bonds, this positive correlation weakened in months when the equity market fell. This is critical because those are the months that you want, maybe need, those diversification benefits of bonds (chart 5).
Investment Implications
We would certainly concede that currently the outlook for bonds remains poor as yields appear poised to climb further. But after two months of such activity, the forward returns for bonds are starting to rise. Not enough to get excited about, but they’re improving, nonetheless (we remain focused on being short duration). And while we would encourage adopting different diversification tools for volatility management, when the “you know what” hits the fan, bonds have a long history of delivering that stability. Even in environments with upward trending yields.
Charts are sourced to Bloomberg L.P. unless otherwise noted.
The contents of this publication were researched, written and produced by Richardson Wealth Limited and are used herein under a non-exclusive license by Echelon Wealth Partners Inc. (“Echelon”) for information purposes only. The statements and statistics contained herein are based on material believed to be reliable but there is no guarantee they are accurate or complete. Particular investments or trading strategies should be evaluated relative to each individual's objectives in consultation with their Echelon representative.
Forward Looking Statements
Forward-looking statements are based on current expectations, estimates, forecasts and projections based on beliefs and assumptions made by author. These statements involve risks and uncertainties and are not guarantees of future performance or results and no assurance can be given that these estimates and expectations will prove to have been correct, and actual outcomes and results may differ materially from what is expressed, implied or projected in such forward-looking statements.
The opinions expressed in this report are the opinions of the author and readers should not assume they reflect the opinions or recommendations of Echelon Wealth Partners Inc. or its affiliates. Assumptions, opinions and estimates constitute the author’s judgment as of the date of this material and are subject to change without notice. We do not warrant the completeness or accuracy of this material, and it should not be relied upon as such. Before acting on any recommendation, you should consider whether it is suitable for your particular circumstances and, if necessary, seek professional advice. Past performance is not indicative of future results. These estimates and expectations involve risks and uncertainties and are not guarantees of future performance or results and no assurance can be given that these estimates and expectations will prove to have been correct, and actual outcomes and results may differ materially from what is expressed, implied or projected in such forward-looking statements.
The particulars contained herein were obtained from sources which we believe are reliable, but are not guaranteed by us and may be incomplete. The information contained has not been approved by and are not those of Echelon Wealth Partners Inc. (“Echelon”), its subsidiaries, affiliates, or divisions including but not limited to Chevron Wealth Preservation Inc. This is not an official publication or research report of Echelon, the author is not an Echelon research analyst and this is not to be used as a solicitation in a jurisdiction where this Echelon representative is not registered.
The opinions expressed in this report are the opinions of its author, Richardson Wealth Limited (“Richardson”), used under a non-exclusive license and readers should not assume they reflect the opinions or recommendations of Echelon Wealth Partners Inc. (“Echelon”) or its affiliates.
This is not an official publication or research report of Echelon, the author is not an Echelon research analyst and this is not to be used as a solicitation in a jurisdiction where this Echelon representative is not registered. The information contained has not been approved by and are not those of Echelon, its subsidiaries, affiliates, or divisions including but not limited to Chevron Wealth Preservation Inc. The particulars contained herein were obtained from sources which we believe are reliable, but are not guaranteed by us and may be incomplete.
Assumptions, opinions and estimates constitute the author’s judgment as of the date of this material and are subject to change without notice. Echelon and Richardson do not warrant the completeness or accuracy of this material, and it should not be relied upon as such. Before acting on any recommendation, you should consider whether it is suitable for your particular circumstances and, if necessary, seek professional advice. Past performance is not indicative of future results. These estimates and expectations involve risks and uncertainties and are not guarantees of future performance or results and no assurance can be given that these estimates and expectations will prove to have been correct, and actual outcomes and results may differ materially from what is expressed, implied or projected in such forward-looking statements.
Forward-looking statements are based on current expectations, estimates, forecasts and projections based on beliefs and assumptions made by author. These statements involve risks and uncertainties and are not guarantees of future performance or results and no assurance can be given that these estimates and expectations will prove to have been correct, and actual outcomes and results may differ materially from what is expressed, implied or projected in such forward-looking statements.