Inflation sucks. It is essentially a tax on those consuming goods or services, as things simply cost more. Even worse, it is a regressive tax given lower income/wealth consumers tend to spend a higher portion of their income. Now, if you are sitting comfortably on your nest egg and not spending too much, should inflation worry you? That depends on this raging debate as to whether the current spike in inflation is a blip caused by temporary demand and supply imbalances…or the start of something longer term. If inflation runs hotter for longer, the value of that nest egg erodes in real terms—clearly a risk to any long-term financial plan.
Currently the good news is higher prices have been predominantly found in what the Atlanta Fed calls ‘flexible priced categories.’ Breaking down the categories in the Consumer Price Index (CPI) into those that are flexible and those that are sticky clearly demonstrates that the headline number is being almost completely pushed higher by the flexible categories. The good news is the prices in these categories can come back down just as fast, supporting the “inflation is transitory” argument. In fact, many have started this descent.
A confluence of factors caused the CPI spike. The pandemic disrupted logistic supply chains that have been increasingly run tighter over the years to reduce costs. Demand came back faster than expected and focused more on durable goods. Global spending behaviours changed quickly. Meanwhile supply adjustments are not as quick. Based on manufacturing survey data, it appears that the worse may be behind us. Readings are still high in many PMI survey questions, including slower delivery times, customer inventories too low, and backlogs rising, but they appear to have peaked a few months ago and are moving in the right direction.
So, all clear on inflation then? Not so fast. The headline inflation should continue to come back down as supply gradually adjusts to demand, but there are now signs of wage pressures building. Wages are more dangerous as they rarely ever come back down. Not sure if you have ever tried to tell an employee they will make less next year, not a frequent conversation for anyone. Of course, some may recall the wage spiralling in the 1970s that contributed to very high levels of inflation. For while wages are not a category in CPI, they feed into the cost structure of so many categories, it can be a material contributor to more widespread inflation.
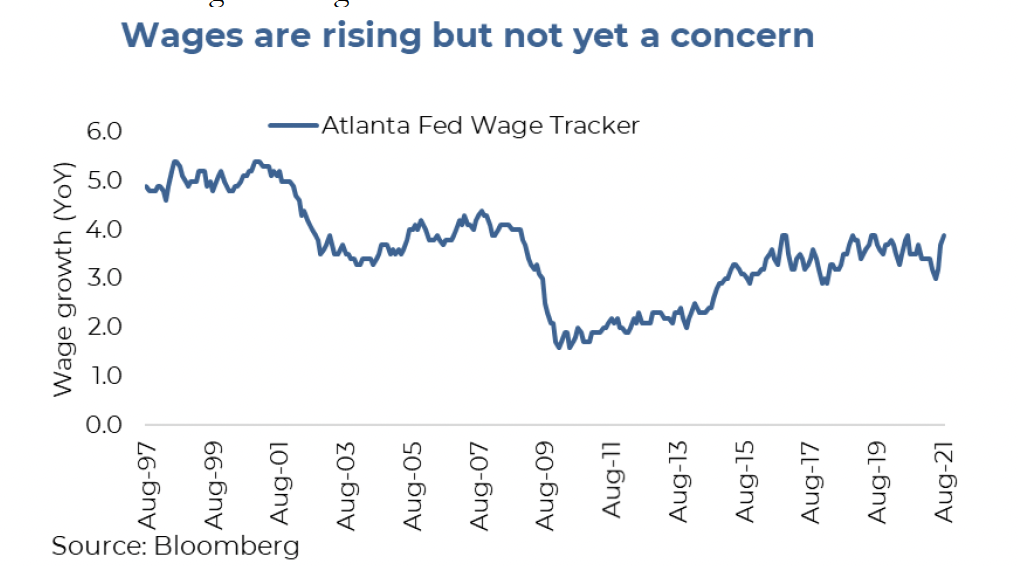
The signs of wage pressures are not at all alarming today, but they have been building. Atlanta Fed’s wage tracker is currently showing 3.9% growth in wages, which is high but not too concerning. But there are other signs, such as rising overtime and an increasing quit rate, that can’t be ignored. People have been quitting at a record pace—the quit rate was 3.6% in August, which is the highest pace people have voluntarily left their jobs since the data series began in 2001. Before this summer, the quit rate had never even been over 3%. Why is this worth highlighting? Well, people rarely quit their jobs to take one with a lower or the same wage: it is more often for more money.
Indications of wage pressures are also starting to increasingly show up on company earnings calls. Scanning for the frequency of executives using the phrases “wage pressure” or “labour shortage” during earnings calls shows there is mounting concern. A few industries mentioning these risks the most often over the past three months have been hotels, restaurants, commercial services (i.e., logistics companies), and banks.
We have already seen some companies either warn or miss earnings with management attributing wages and labour as negative contributing factors, which brings up the topic of labour sensitivity. Some companies use more capital relative to labour to generate sales. Energy, utilities, and communication services, for example, are capital intensive. This makes them less sensitive to wage pressures. Meanwhile, consumer discretionary, industrials, and consumer staples tend to use more people to generate sales, meaning the sectors are clearly more at risk. Of course, it really depends on the specific company as these sectors are rather broad and capture many sub-industries. For example, health care looks relatively safe given the sales per employee. Although while this may be the case for pharmaceutical companies, it is less so for health care service providers.
Investment implications
The transitory argument could be applied to labour as well as it pertains to wages. The pandemic caused some jobs to disappear for over a year, other jobs were in super high demand, and government jumped in to send enhanced benefits to many. Now service jobs are coming back, demand is normalizing, and benefits are fading. Is it any wonder distortions in the labour market are causing wage pressures given these gyrations?
These may fade in the longer term as the market adjusts, but for now the risk is for rising wage pressures in the months/quarters ahead. If this does occur, central banks are likely going to speed up their removal of supportive measures. While they can ignore transitory inflation pressures, wages are another matter. Investors in individual equities may want to dig a little deeper to ascertain their portfolios sensitivity to higher wages or reduce in case these pressures continue to build.
Charts are sourced to Bloomberg L.P. unless otherwise noted. This report is authored by Craig Basinger, Chief Market Strategist, Purpose Investments Inc.
The contents of this publication were researched, written and produced by Richardson Wealth Limited and are used herein under a non-exclusive license by Echelon Wealth Partners Inc. (“Echelon”) for information purposes only. The statements and statistics contained herein are based on material believed to be reliable but there is no guarantee they are accurate or complete. Particular investments or trading strategies should be evaluated relative to each individual's objectives in consultation with their Echelon representative.
Forward Looking Statements
Forward-looking statements are based on current expectations, estimates, forecasts and projections based on beliefs and assumptions made by author. These statements involve risks and uncertainties and are not guarantees of future performance or results and no assurance can be given that these estimates and expectations will prove to have been correct, and actual outcomes and results may differ materially from what is expressed, implied or projected in such forward-looking statements.
The opinions expressed in this report are the opinions of the author and readers should not assume they reflect the opinions or recommendations of Echelon Wealth Partners Inc. or its affiliates. Assumptions, opinions and estimates constitute the author’s judgment as of the date of this material and are subject to change without notice. We do not warrant the completeness or accuracy of this material, and it should not be relied upon as such. Before acting on any recommendation, you should consider whether it is suitable for your particular circumstances and, if necessary, seek professional advice. Past performance is not indicative of future results. These estimates and expectations involve risks and uncertainties and are not guarantees of future performance or results and no assurance can be given that these estimates and expectations will prove to have been correct, and actual outcomes and results may differ materially from what is expressed, implied or projected in such forward-looking statements.
The particulars contained herein were obtained from sources which we believe are reliable, but are not guaranteed by us and may be incomplete. The information contained has not been approved by and are not those of Echelon Wealth Partners Inc. (“Echelon”), its subsidiaries, affiliates, or divisions including but not limited to Chevron Wealth Preservation Inc. This is not an official publication or research report of Echelon, the author is not an Echelon research analyst and this is not to be used as a solicitation in a jurisdiction where this Echelon representative is not registered.
The opinions expressed in this report are the opinions of its author, Richardson Wealth Limited (“Richardson”), used under a non-exclusive license and readers should not assume they reflect the opinions or recommendations of Echelon Wealth Partners Inc. (“Echelon”) or its affiliates.
This is not an official publication or research report of Echelon, the author is not an Echelon research analyst and this is not to be used as a solicitation in a jurisdiction where this Echelon representative is not registered. The information contained has not been approved by and are not those of Echelon, its subsidiaries, affiliates, or divisions including but not limited to Chevron Wealth Preservation Inc. The particulars contained herein were obtained from sources which we believe are reliable, but are not guaranteed by us and may be incomplete.
Assumptions, opinions and estimates constitute the author’s judgment as of the date of this material and are subject to change without notice. Echelon and Richardson do not warrant the completeness or accuracy of this material, and it should not be relied upon as such. Before acting on any recommendation, you should consider whether it is suitable for your particular circumstances and, if necessary, seek professional advice. Past performance is not indicative of future results. These estimates and expectations involve risks and uncertainties and are not guarantees of future performance or results and no assurance can be given that these estimates and expectations will prove to have been correct, and actual outcomes and results may differ materially from what is expressed, implied or projected in such forward-looking statements.
Forward-looking statements are based on current expectations, estimates, forecasts and projections based on beliefs and assumptions made by author. These statements involve risks and uncertainties and are not guarantees of future performance or results and no assurance can be given that these estimates and expectations will prove to have been correct, and actual outcomes and results may differ materially from what is expressed, implied or projected in such forward-looking statements.