No, this is not a homage to one of the great hard rock bands of all-time, but we will do our best to work ‘welcome to the jungle’ into this Ethos. Instead, we are talking about little ‘g’ and little ‘r’ – two of the most important inputs for market valuations. In fact, little ‘g’ n’ little ‘r’ are so powerful, they could even justify current market valuations and provide a cautionary cue for the coming quarters. But first, when it comes to valuations for the market, price-to-earnings (PE) is certainly the more common measure. PE is a quick and easy gauge for valuation, especially contrasting with historical levels. For example, the S&P 500 is trading 21x earnings, that is high based on the long-term historical average of 16x. But this is lazy math. Price divided by earnings, whether trailing or better yet, estimates for the next 12-months, hardly encapsulates the value of a company or market. It ignores growth of those earnings in future years, variability in those earnings, leverage, or returns available in competing investments. Not implying investors should ignore PE ratios, but there are limitations.
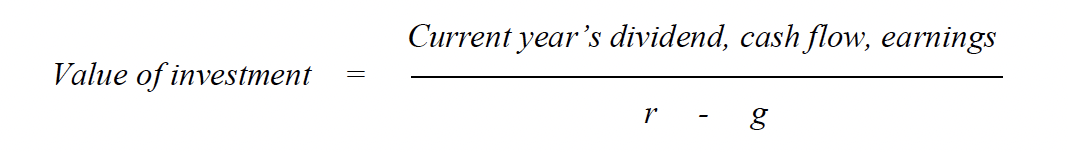
More serious valuation approaches are often built around the time value of money, a very prevalent methodology in the bond market. The names of these models include discounted cash flow or dividend discount models. Essentially, they attempt to value something – a company, an index, a bond – based on the future cash flow or dividends or earnings for many years into the future, discounted to adjust for time and risk. While the formulas differ, the following is a loose generalization that will suffice for us:
The little ‘g’ and little ‘r’ in the denominator of the equation have a huge impact on the value of the investment. Little ‘g’ (henceforth just called ‘g’) is the expected long-term or perpetual annual growth of the dividend, cash flow, or earnings from the top numerator of the equation. Of course, who knows what the future holds? For a company, we can probably have a good idea on earnings for a year or two… but in 2030? Plus, $1 of earnings or dividends in 2030 is certainly worth less than $1 in 2021. The little ‘r’ (now just ‘r’ too) discounts those future earnings, incorporating many factors.
‘r’ is influenced by the variability of the investment’s future growth rate. If less certain about ‘g’ or the future, then ‘r’ is bigger. Alternative investment returns, such as the risk-free rate or yield on government bonds, influence ‘r’. Inflation impacts ‘r’, as if inflation is higher then the future earnings must be discounted at a higher rate. ‘r’ tries to capture many of the risks to the future earnings or dividends or cash flow.
Rising ‘g’ & Smaller ‘r’: A Great Combo for Markets
If ‘g’ gets bigger, the value of the investment goes up. Logically, cash flow or earnings growing faster is clearly good. During the past year and a half, this is precisely what has been happening, contributing to the markets push higher. It does not take a professional tea leaf reader to see that earnings have come roaring back, exceeding expectations in a meaningful way. Clearly the re-opening of the economy has been a huge tailwind for earnings. But companies have also pivoted and adjusted really well, in aggregate, to this ever-changing environment. The degree of this earnings growth is breathtaking. 2021, assuming forecasts for Q3 and Q4 earnings hold, will come in at about $199 for the S&P 500. The previous peak in calendar earnings was $157 in 2019 and only broke the $100 level in 2013. This rapid earnings growth has nudged the long term ‘g’ higher.
At the same time, ‘r’ has become smaller. The biggest reduction in ‘r’ has likely come from the declining uncertainty around the impact of the pandemic. Less risk equals a lower ‘r’.
And if ‘r’ gets smaller, driven lower by any combination of less uncertainty about the future, lower interest rates, or less inflation, the value of the investment goes up. This combination is precisely what has happened to the equity markets over the past year and a half. A rising ‘g’ and a falling ‘r’, driving the value of the investment higher.
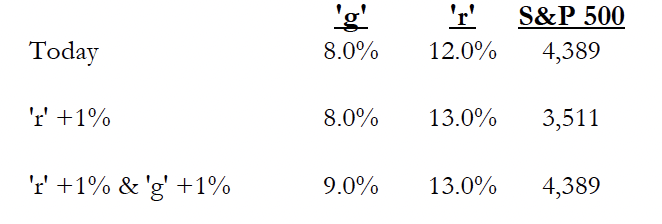
Some more fun with math. Let’s say ‘g’ is the median long-term yearly growth rate in earnings for the S&P 500, which is about 8% over the past eighty years. Not an unreasonable assumption, given economic growth is starting to normalize, and this will likely bring earnings growth back closer to the long-term trend. With the trailing earnings of the S&P 500 of $157, this equates to an ‘r’ of 12%. ‘r’ includes many components, including uncertainty about the future, the risk-free rate, inflation, and yields.
What if the combination of inflation and rising yields lifts the long term ‘r’ from 12% to 13%? If nothing else changes, the S&P becomes 3,511. Don’t get excited, this isn’t a forecast, but it does highlight the sensitivity of the current market to changes in things such as the long run inflation rate and yields. Fortunately, higher inflation and yields may lift ‘g’ a bit higher, helping offset the negative impact of a higher ‘r’. Certain markets benefit more from this natural offset, namely those with a greater weight to companies that benefit from inflation or rising yields, such as the TSX.
Investment implications
The markets over the past year and a half have really benefited from a rising ‘g’ and a falling ‘r’ – a very powerful combination. While all markets have benefited, it has not been uniform in magnitude, lifting some markets more than others. Those equity markets that are longer duration or growth tilted, are more sensitive to both ‘g’ and ‘r’ and have rallied more so (S&P 500). Those markets that are more cyclical or value tilted have proven less sensitive (TSX, Europe). Once more, another reason to consider adding to TSX or international equity weight at the expense of U.S. equity. Now, if you are in our camp and agree the economic recovery is losing momentum and normalizing at the same time yields are trending up due to a combination of tapering and inflation pressure, the trend in both ‘g’ and ‘r’ may be poised to change from tailwinds to headwinds. Welcome to the Jungle does not seem appropriate, perhaps November Rain.
Source: Charts are sourced to Bloomberg L.P. and Purpose Investments Inc.
The contents of this publication were researched, written and produced by Purpose Investments Inc. and are used by Echelon Wealth Partners Inc. for information purposes only.
This report is authored by Craig Basinger, Chief Market Strategist, Purpose Investments Inc.
The contents of this publication were researched, written and produced by Purpose Investments Inc. and are used herein under a non-exclusive license by Echelon Wealth Partners Inc. (“Echelon”) for information purposes only. The statements and statistics contained herein are based on material believed to be reliable but there is no guarantee they are accurate or complete. Particular investments or trading strategies should be evaluated relative to each individual's objectives in consultation with their Echelon representative.
Echelon Wealth Partners Ltd.
The opinions expressed in this report are the opinions of the author and readers should not assume they reflect the opinions or recommendations of Echelon Wealth Partners Ltd. or its affiliates. Assumptions, opinions and estimates constitute the author's judgment as of the date of this material and are subject to change without notice. We do not warrant the completeness or accuracy of this material, and it should not be relied upon as such. Before acting on any recommendation, you should consider whether it is suitable for your particular circumstances and, if necessary, seek professional advice. Past performance is not indicative of future results. The comments contained herein are general in nature and are not intended to be, nor should be construed to be, legal or tax advice to any particular individual. Accordingly, individuals should consult their own legal or tax advisors for advice with respect to the tax consequences to them.
Purpose Investments Inc.
Purpose Investments Inc. is a registered securities entity. Commissions, trailing commissions, management fees and expenses all may be associated with investment funds. Please read the prospectus before investing. If the securities are purchased or sold on a stock exchange, you may pay more or receive less than the current net asset value. Investment funds are not guaranteed, their values change frequently and past performance may not be repeated.
Forward Looking Statements
Forward-looking statements are based on current expectations, estimates, forecasts and projections based on beliefs and assumptions made by author. These statements involve risks and uncertainties and are not guarantees of future performance or results and no assurance can be given that these estimates and expectations will prove to have been correct, and actual outcomes and results may differ materially from what is expressed, implied or projected in such forward-looking statements. Assumptions, opinions and estimates constitute the author’s judgment as of the date of this material and are subject to change without notice. Neither Purpose Investments nor Echelon Partners warrant the completeness or accuracy of this material, and it should not be relied upon as such. Before acting on any recommendation, you should consider whether it is suitable for your particular circumstances and, if necessary, seek professional advice. Past performance is not indicative of future results. These estimates and expectations involve risks and uncertainties and are not guarantees of future performance or results and no assurance can be given that these estimates and expectations will prove to have been correct, and actual outcomes and results may differ materially from what is expressed, implied or projected in such forward-looking statements. Unless required by applicable law, it is not undertaken, and specifically disclaimed, that there is any intention or obligation to update or revise the forward-looking statements, whether as a result of new information, future events or otherwise.
Before acting on any recommendation, you should consider whether it is suitable for your particular circumstances and, if necessary, seek professional advice.
The particulars contained herein were obtained from sources which we believe are reliable, but are not guaranteed by us and may be incomplete. This is not an official publication or research report of either Echelon Partners or Purpose Investments, and this is not to be used as a solicitation in any jurisdiction.
This document is not for public distribution, is for informational purposes only, and is not being delivered to you in the context of an offering of any securities, nor is it a recommendation or solicitation to buy, hold or sell any security.