The rotation out of Growth and into Value as we started 2022 has been, well, violent. As of Thursday, January 20, the S&P 500 Growth Index was down 9.6% so far this year while the Value version of the index is off a mere 1.8%. If the month of January ended now, this would be in the top 10 months measured by divergence of one style over another during the past 25 years. Keep in mind, that time period includes three bear markets and the tech boom/bust.
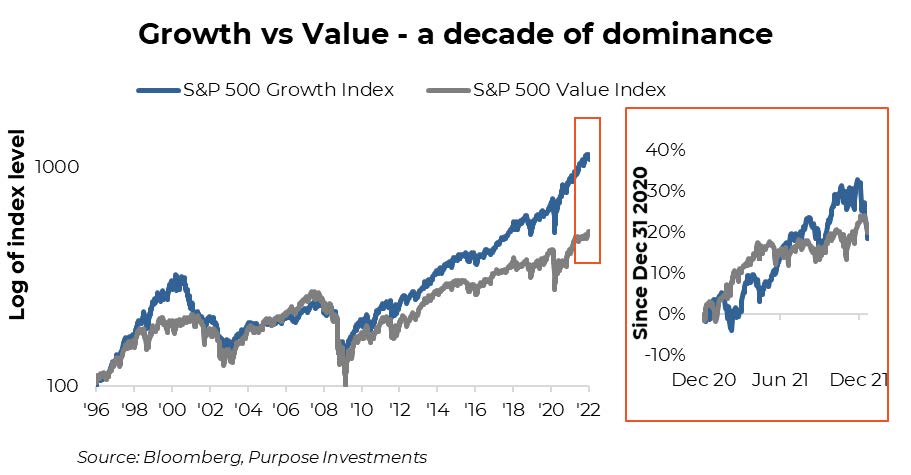
Growth has been dominating value for much of the past decade, with the S&P 500 Growth index rising 457% (18.9% annualized) compared to 231% for Value (12.8% annualized). Could the leadership have just abruptly changed as the Time Square new years ball dropped?
Looking at the above chart, one could easily argue that Growth had gone too far relative to Value and is due to revert. Mean reversion is one of the more reliable forces in the capital markets. That said, you could have made the same argument at any point over the past three plus years. But this potential change in leadership may not be as abrupt as many believe. Value and Growth, in the U.S. large cap market, have been battling it out for over a year now (same chart, orange box on the right).
We believe we are partway through a potential transition phase that will continue to see Value and Growth battling it out for leadership. While the relative outperformance of Value so far this month is extreme, Growth outperformed Value by 7% last June, a mere six months ago. It’s noteworthy that most months that witnessed >5% outperformance by either style occurred at the tail end of the tech bubble and subsequent leadership change. If the pattern has any similarity to the early 2000s, this seesaw leadership will be normal for awhile.
Now it is possible this is simply another wobble in the growth market that will pass and see the dominance over Value continue. There have been many such wobbles over the past decade. Change in leadership is only 100% certain well after it has occurred. And that does little for investment positioning. That said, we believe the deck has become increasingly stacked against Growth.
Valuations – Historically, Growth names have traded at a premium valuation to Value. They are growing faster by definition, so should have a higher multiple. But the multiple premium reached last year was extreme. The valuation spread has come back down a little but remains historically elevated. In other words, Value compared with Growth is cheap based on historical relative valuations.
Inflation & Yields – Bond yields have certainly been trending higher with the U.S. 10-year Treasury bellwether now in the 1.80s. Given growth companies tend to have more of their earnings further down the road, higher yields result in a higher discount rate being applied to these future earnings. This too favours Value over Growth.
Concentration – The U.S. equity market has become very concentrated among a number of megacap names, and they are all Growth. While the larger names in the S&P 500 in the late 1990s were certainly tilted towards more tech names, there were some non-tech names as well. Today, the top S&P 500 names are Apple (6.7%), Microsoft (5.9%), Amazon (3.5%), Alphabet (4.1%), Tesla (2.1%), Meta (2.0%), Nvidia (1.6%), and then finally Berkshire (1.5%). You have to go down to #8 before hitting a company not loosely classified as tech. This concentration carries added risk.
Investment Implications
Of course, we cannot be certain this long overdue rotation is on or if this is just another test of the entrenched leaders. Softer inflation data could easily have the central banks slowing their tightening plans. Q4 earnings season could provide more solid encouragement. And softer economic data could tame yields back down a bit. Any of these could easily reverse the recent weakness in growth stocks.
This is an earlier-than-expected taste of the more volatile 2022 we highlighted in our outlook. As before and now,
we see greater safety in Value relative to Growth, even with the NASDAQ down 10%. Our approach remains to be a bit underweight U.S. equities and have a more value tilt for the remaining allocation. For us, this means some U.S. exposure with a dividend focus and holding an equal weighted S&P ETF.
Equal weight is an easy way to remain exposed to many of the great companies that make up the U.S. equity market—there are many great companies—but without the concentration issues of the megacaps tech names.
Value is also much more prevalent in Canada and internationally: our two equity overweights. After last year’s strong earnings growth globally, valuations in Europe, Asia, and Canada have all come back down to more normal historical levels. Sure, these companies may not be as exciting to share stories about at cocktail parties (virtual ones), but then again, we are not story-telling investors.
Source: Charts are sourced to Bloomberg L.P. and Purpose Investments Inc.
The contents of this publication were researched, written and produced by Purpose Investments Inc. and are used by Echelon Wealth Partners Inc. for information purposes only.
This report is authored by Craig Basinger, Chief Market Strategist, Purpose Investments Inc.
The contents of this publication were researched, written and produced by Purpose Investments Inc. and are used herein under a non-exclusive license by Echelon Wealth Partners Inc. (“Echelon”) for information purposes only. The statements and statistics contained herein are based on material believed to be reliable but there is no guarantee they are accurate or complete. Particular investments or trading strategies should be evaluated relative to each individual's objectives in consultation with their Echelon representative.
Echelon Wealth Partners Ltd.
The opinions expressed in this report are the opinions of the author and readers should not assume they reflect the opinions or recommendations of Echelon Wealth Partners Ltd. or its affiliates. Assumptions, opinions and estimates constitute the author's judgment as of the date of this material and are subject to change without notice. We do not warrant the completeness or accuracy of this material, and it should not be relied upon as such. Before acting on any recommendation, you should consider whether it is suitable for your particular circumstances and, if necessary, seek professional advice. Past performance is not indicative of future results. The comments contained herein are general in nature and are not intended to be, nor should be construed to be, legal or tax advice to any particular individual. Accordingly, individuals should consult their own legal or tax advisors for advice with respect to the tax consequences to them.
Purpose Investments Inc.
Purpose Investments Inc. is a registered securities entity. Commissions, trailing commissions, management fees and expenses all may be associated with investment funds. Please read the prospectus before investing. If the securities are purchased or sold on a stock exchange, you may pay more or receive less than the current net asset value. Investment funds are not guaranteed, their values change frequently and past performance may not be repeated.
Forward Looking Statements
Forward-looking statements are based on current expectations, estimates, forecasts and projections based on beliefs and assumptions made by author. These statements involve risks and uncertainties and are not guarantees of future performance or results and no assurance can be given that these estimates and expectations will prove to have been correct, and actual outcomes and results may differ materially from what is expressed, implied or projected in such forward-looking statements. Assumptions, opinions and estimates constitute the author’s judgment as of the date of this material and are subject to change without notice. Neither Purpose Investments nor Echelon Partners warrant the completeness or accuracy of this material, and it should not be relied upon as such. Before acting on any recommendation, you should consider whether it is suitable for your particular circumstances and, if necessary, seek professional advice. Past performance is not indicative of future results. These estimates and expectations involve risks and uncertainties and are not guarantees of future performance or results and no assurance can be given that these estimates and expectations will prove to have been correct, and actual outcomes and results may differ materially from what is expressed, implied or projected in such forward-looking statements. Unless required by applicable law, it is not undertaken, and specifically disclaimed, that there is any intention or obligation to update or revise the forward-looking statements, whether as a result of new information, future events or otherwise.
Before acting on any recommendation, you should consider whether it is suitable for your particular circumstances and, if necessary, seek professional advice.
The particulars contained herein were obtained from sources which we believe are reliable, but are not guaranteed by us and may be incomplete. This is not an official publication or research report of either Echelon Partners or Purpose Investments, and this is not to be used as a solicitation in any jurisdiction.
This document is not for public distribution, is for informational purposes only, and is not being delivered to you in the context of an offering of any securities, nor is it a recommendation or solicitation to buy, hold or sell any security.