The end of 2021 nears, and it was clearly a win for investors.
Although the pandemic retains it grip on humanity, economies, companies, and behaviours have adapted relatively well, in aggregate. 2022 looks like it will be a more challenging year, as some trends are poised to change, which adds uncertainty. But, there is good news too, as the global economy appears to be expanding with solid momentum.
This year ahead outlook is a collaboration among the investment management team at Purpose Investments. A team that continues to expand in both numbers and breadth. In the report, you will find:
I. Market Recap – 2021 A Good Year with Many Market Surprises
II. Key Macro Trends for 2022
• The global tightening cycle has begun
• Economic growth continues to broaden
• Inflation risks remain persistent
III. Market Cycle & Portfolio Positioning
• Current market cycle
• Portfolio positioning
IV. Rising Trends in Asset Allocation
• Searching for alternative sources of diversification
• Positioning for continued energy transition
• Defending your long-term financial plans from inflation
2021 – A Good Year with Many Market Surprises
— Greg Taylor
Looking back at a year where many equity indices were higher by 15% or more, you could assume that it was a rather dull year and easy to make money. However, that wasn’t the necessarily the case as many multi-year trends reversed, and we expect many more trends to be at risk of turning in the near term.
The year started with one of the strangest rallies in market history—the rally of the ‘broken’ meme stocks. In many cases, this trend was the result of the return of the retail investor, rediscovering the stock market and day trading during lockdown. Through tools such as the Robinhood trading platform, which gave access to options, leverage, and social media chat groups, these investors were able to cause massive moves in the most-shorted companies in the market. In the end, these share-price moves hurt many established hedge funds, which were on the wrong side of the new trend.
It wasn’t only the meme stocks that participated in this retail mania. Cryptocurrency joined the party too. And not just the usually suspects, like Bitcoin, this year DeFi tokens, coins like Ether, Solana, and even dogecoin, and non-fungible tokens (NFTs) all experienced a surge in popularity.
Like many historical rallies, looking back in a few years, we will shake our heads at some of these moves, but like the dot.com bubble, there will also be several winners that come out of this trend and go on to change the world. Could it be Ethereum? How Ether should fit into investor’s asset mix will be a fascinating debate over the years to come—it doesn’t seem like an asset class that investors can ignore going forward.
Outside of the more speculative pockets of the market, there were also strong returns in many traditional parts of the market, notably the cyclicals, in particular the energy stocks. This sector had been left for dead in the new ESG world, as investors assumed demand would fade away and the group would disappear. However,
those who ignored it missed the best performing group for the year.
As everyone was focused on other topics, this sector has been transforming itself to increasingly meet ESG demands, in many cases better than many other industries. The bad actors have faded away and the remaining companies cleaned up their operations and adapted to the new normal. At these commodity prices, these companies can return massive amounts of capital to shareholders.
The revenge of value stocks caught many off guard. As the market rally evolved from the immediate pandemic winners (Zoom, DocuSign, and Peloton) to real companies, the game is going to change. One of the lasting impacts of the pandemic is all the monetary/fiscal/cash that was thrown at the problem, and how that will move markets going forward. It is currently being felt in the inflation statistics. Inflation, whether transitory or not, has been a crunch on many sectors, acting as a benefit in some cases and a sneaky tax on consumers in others.
As much as the pandemic has dominated the market commentary over the last couple years, the most important factor for markets will always be the central banks. As the old-age adage goes, “Bull markets don’t die of old age—they are murdered by the Fed.” And it is a very real fear. As the pandemic fades away, it will be important for investors to prepare for a less market friendly Federal Open Market Committee (FOMC). In the near term, the risk will be if the Fed will be making a mistake and removing stimulus too soon or too quickly?
The fact that central banks are taking away stimulus and working to normalize interest rates is not necessarily the end of the bull market, but things will evolve. What investors need to prepare for is more volatility as pivots in central bank behaviour clearly inject greater uncertainty on the policy side. The end of a cycle is never an easy period for investors. Making sure to not just passively buying the market instead and actively managing risk will be more important than ever.
Since the pandemic emerged, equity markets have had a wild ride that has resulted in many all-time highs, but this isn’t a time to be complacent. Bond yields will follow inflation higher and will have a dramatic affect on which sectors will outperform.
The long road to new normal will not be similar to the road in the rear view.
Key Macro Trends for 2022
— Craig Basinger & Derek Benedet
There is both good news and bad news as we look out to 2022. The global economy continues to grow at a very healthy pace. Valuations are not extreme in most markets. Given pent up demand and savings, the consumer is ready, albeit maybe less willing, depending on the path of the Omicron variant. Omicron has reminded investors that markets dislike uncertainty and that this pandemic still has the ability to inject uncertainty back into the minds of investors. We also are starting to see central banks step towards normalization, which is clearly justified given current inflationary pressures and the global economy’s recovery. But that is an economist speaking, the markets prefer more stimulus than less, so how markets react is the key.
In this section, we will share our views on three key trends we believe will be critical for the economy and markets in 2022, which include (1) the path and pace of central bank policies, (2) how the global economy continues to recover, and (3) the inflationary track including impacts on wages and margins.
The global tightening cycle has begun
Few would deny that central bankers have become the superheroes for the markets. Whenever the outlook turns ominous and it looks like things are falling apart, they show up just in time and inject a few billion (or trillion) of capital to help part the clouds and let the sunshine back onto the markets. Now with the economy on more solid footing, the trend among central banks has them taking their foot slowly off the monetary gas pedal.
Over the past three months, ten of the bigger central banks hiked their respective overnight rates. So far these hikes have been mainly among developing nations, but the bigger central banks are getting closer to following suit. Quantitative easing (QE) is also on the decline. The Bank of Canada ended QE a few months back, and others have slowed their bond buying. Of course, all eyes remain on the U.S. Fed’s plans as they have started to ‘taper’ bond purchases. Each incremental taper gets the market closer to rate hikes.
The market is currently pricing in 2 ½ rate hikes by the Fed in 2022, starting around mid year. The UK and Canada are forecast to move sooner, and the eurozone later. Any way you cut it, unless the economy or markets derail, the tightening cycle is upon us.
If history is our guide, which arguably is more concrete than simply hypothesising about the future, this isn’t a bad scenario. Focusing on the Fed, since they are the bigger driver of market reactions, the starting of a tightening cycle is not overly bad for markets, or even the bond market. Intuitively this does make sense. The Fed starts hiking when the market and economy are strong enough to remove accommodation or become more hawkish. Hopefully this will cool parts of the economy that may be overheating and give the central bank more flexibility should weakness arise down the road.
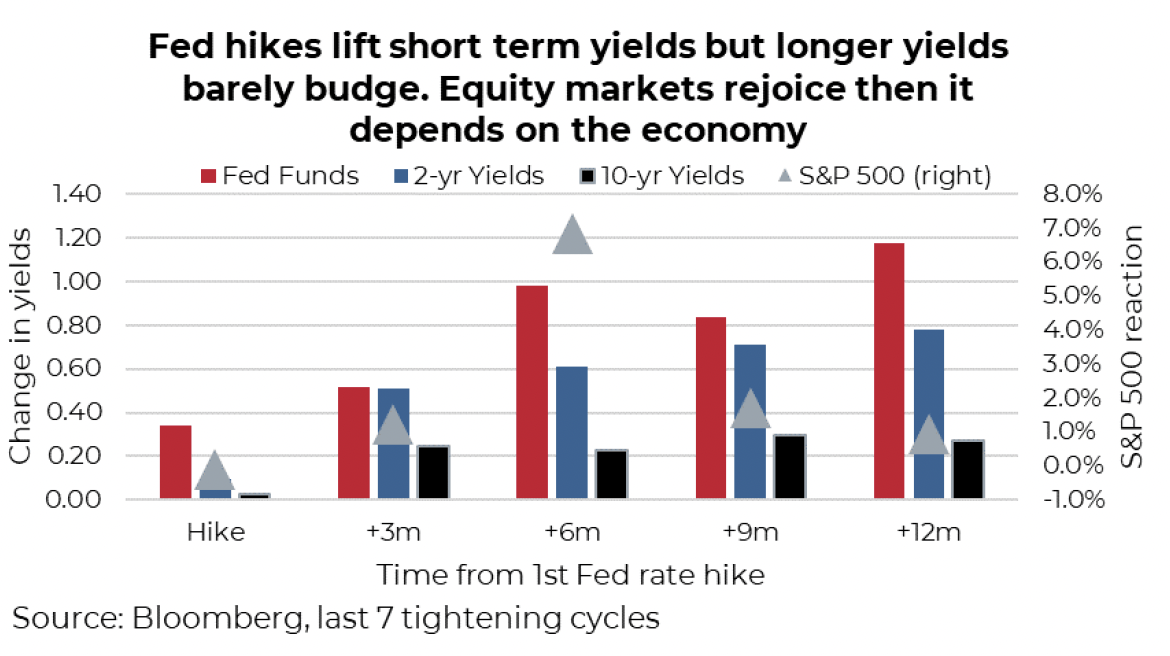
Looking at the market reaction to the last seven Fed tightening cycles, there is more good news than bad. Starting with bond yields, rising the overnight rate obviously puts upward pressure on shorter-term yields—that is simple math. However, for longer-term yields such as the 10-year, the reaction is very muted, and in just under half the scenarios (three or seven), the 10-year yield was lower six months later after the first-rate hike.
The bond market is not stupid: yields usually move higher well in advance of the start of a hiking cycle. Note that the 10-year yield has moved up over the past few months even with added Omicron gyrations.
Turning to equities, the S&P 500 was higher six months later in all occasions. Sure, volatility rose as the market adjusted to the change in monetary policy but again with the Fed hiking because things are going better in the economy, equity markets are amendable. A year later, things are cloudier. If there is a recession looming after the hiking cycle starts (four of the seven), the equity outlook a year later is not good. If there is no pending recession, go bull go.
There are clearly risks to this gradual pending pivot in global monetary policy. On one hand, it is likely overdue given inflationary price pressures and how far the economy has recovered. However, asset prices have been inflated over the past year-and-a-half thanks to these monetary policies. This includes stock prices, bond prices, and house prices. The price sensitivity to tightening monetary policies may be higher than historical patterns.
2022 will be a monetary adjustment year as policy moves back towards normal. Given current economic strength, we don’t believe a recession is imminent, which has us believing this will simply add to market swings but not trigger a bear.
Economic growth continues to broaden
Looking out to the year ahead, the global growth outlook hinges on keeping the recovery on track. Global vaccination progress remains critical to reduce the virus’s impact on real gross domestic product (GDP) growth. Unfortunately, the situation with the virus remains very fluid. The emergence of Omicron presents a new twist, and admittedly with the science still playing catch up, it creates bit of a blind spot. Vaccine efficacy and the severity of the disease are two large unknows at present.
It’s difficult to write a complete playbook for the year ahead; however, we venture that the economic risk from Omicron is relatively low and stress that each new wave has a more muted impact on economic activity.
The global economy will continue to rebound despite current headwinds in the form of supply chain bottleneck pressures and ongoing pandemic flareups. Mobility restrictions introduced in Europe and potentially other parts of the globe are damaging to growth but likely not comparable to last winter in terms of duration or strictness. Rather than focus on risks that we believe will continue to fade over the course of the year, investors should keep in mind the strong fundamental currents below these headwinds. The key fundaments remain as follows:
Healthy corporate balance sheets, with companies increasingly willing to invest to continue to grow their businesses. Capex expectations have all been very strong recently, a great precursor to broader growth.
- Excess savings, which has boosted household balance sheets over the course of the pandemic. Add on the wealth effect of surging home price values and this creates a very healthy environment for personal spending on goods as well as an expected shift to services over the coming year.
- Ongoing backdrop of pent-up demand, especially for the service sector. As mobility restrictions ease globally, it makes sense to assume that services expenditure will occupy a more important role in shaping total spending. Growth expectations for services is now outpacing hard manufacturing goods, which we also expect to remain strong. Services expenditure is still lower than it was a year ago in the US, and overall remains low globally compared with pre-pandemic patterns.
- Accommodative policy both monetary and fiscal: Many central banks have already ended their extraordinary easing policies, and the Fed will soon begin to wind down, but it’s hard to argue that monetary policy will become overly restrictive. As seen in the chart below, financial conditions are considerably looser than historical averages and history would tell us it has only one way to go.
The economic recovery remains uneven with different areas of the world affected by varying degrees of lockdown measures. Though recovery look very different on a regional basis across geographies, compared with pre-pandemic times, global growth expectations remain more synchronized. Overall, growth of global GDP is expected to be strong but moderate in 2022 and 2023 as the recovery moves beyond the rebound phase and the effects of the extraordinary policy stimulus fade.
From an equity market perspective, a backdrop of strong global growth is a strong positive, though earnings pressure is one concern. Rising costs and ongoing supply issues will test even the best companies to maintain what has been a fantastic pace of growth. Pricing pressure will inevitably test margins or the willingness for end consumers to bear the brunt of rising costs.
Inflation risks remain persistent
It is clearly very trendy to talk about the price of milk, gasoline, used cars or how the core consumer price index (CPI) is the highest since the early 1990s. We shouldn’t— it doesn’t really matter. True there are price gyrations going on driven by supply issues, robust return of aggregate demand, and changing spending patterns, but these will sort themselves out. After all, it is profitable for companies to solve supply bottlenecks, spending patterns are unlikely to continue to change in the same direction (are actually starting to reverse), and the best solution for high prices is high prices. This price spike does negatively affect the real value of your portfolio and other assets but given how markets and asset prices have risen over the past year, don’t expect too much sympathy. The big question is what happens next?
The short-term price gyrations will continue well into 2022, certainly making this a recurring topic.
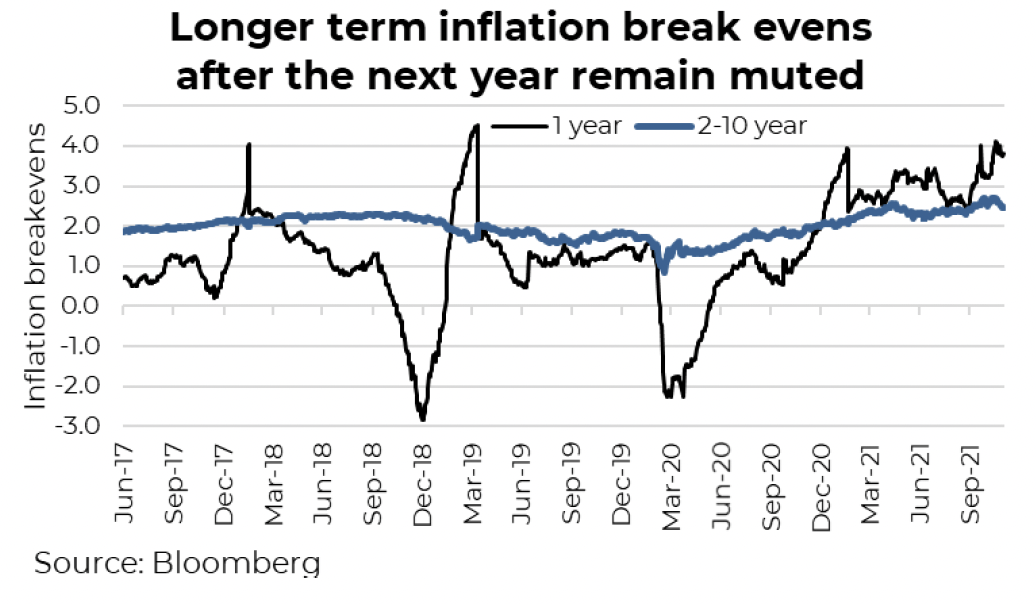
From a market perspective, we should care more about the longer-term inflation expectations, not that CPI is +4.6% compared with last year.
It is these long-term inflation expectations that underpin bond yields, valuations, and discount rates on the price of just about anything. If these move, it has a big impact, much more so than paying an extra 75 cents for milk.
The good news is so far, longer-term inflation expectations have only marginally ticked higher. The following chart is the inflation break-evens being priced into the bond market. True, the one-year reading is elevated at nearly 4% but the implied inflation after the next year out to 2031 (2-10 year) remains muted.
This is the market telling us that much of the rise of current prices is a short-term issue. This is the number that matters more for asset prices, from stocks to bonds to homes.
So, what happens after the short-term price spike? There are some very long-term forces on both sides. The amount of debt in the world remains a deflationary force, and wow is there a lot of debt now! Demographics, the gradual aging of the world population—especially in developed nations—remains a strong deflationary force. But some deflationary forces are diminishing. Globalization, essentially the relocation of manufacturing to lower labour jurisdictions, has been slowing and could slow even faster as companies/governments are rethinking their supply chains. Company mindsets around logistics and inventory appears to be changing from ‘just in time’ to ‘just in case.’ This may pass as the pandemic fades, but if this is a new trend, it is inflationary (or at least a deflationary force is softening).
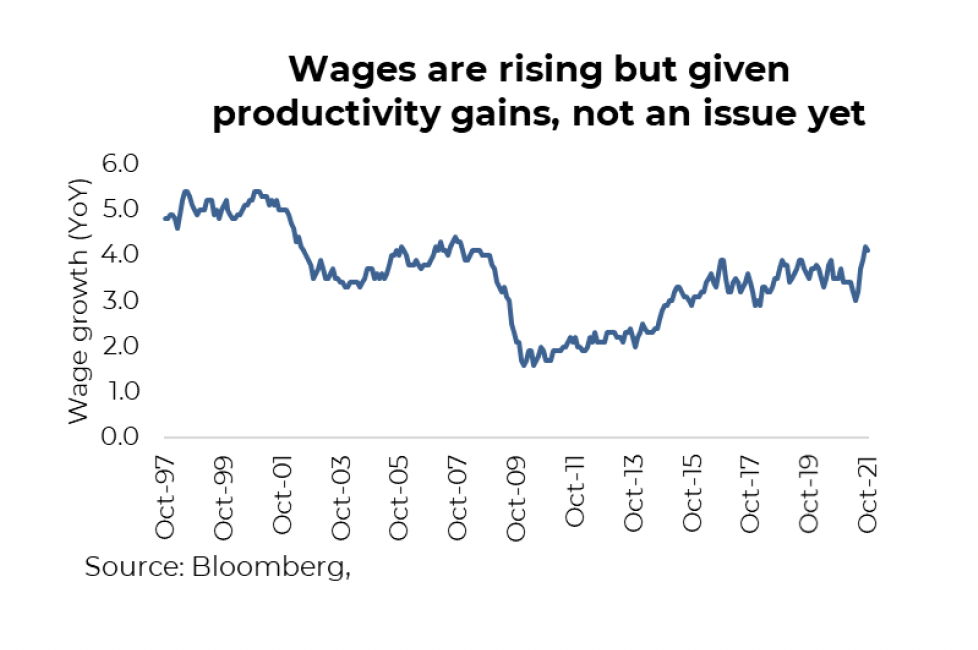
While we expect the CPI inflation impulse to fade in 2022, given how long it is lasting, it is starting to drag longer-term expectations higher. The policy impact has likely not flowed through the system, as it hit bottlenecks from higher savings to lack of goods to buy to inability to spend on some activities during this pandemic, which supports higher inflation expectations going forward and is starting to translate into higher wages.
This isn’t the 1970s (i.e., higher prices with falling productivity) nor is it the late 1940s (i.e., higher prices driven by rebuilding the world). But the inflationary trend is to the upside, and this has implications from financial plans, corporate behaviour on debt and buybacks, value vs growth, yields and valuations. We believe investors should have an inflation protection tilt to their portfolios and consider the impacts of gradually rising longer-term inflation on all investments.
Market Cycle & Portfolio Positioning
Current Market Cycle
— Craig Basinger
Few would disagree that markets have proven very resilient over the past year and a half since emerging from the briefest bear market in history. Periods of market weakness have shown to be fleeting and often end before most react, as the ‘buy the dip’ mantra has been entrenched into the ethos of traders. And while we would not expect 2022 to be as smooth as recent history, characterized by strong returns with limited disruptions, the market cycle indicators continue to point to a healthy encouraging environment.
Currently, a little over 70% of our market cycle indicators remain bullish for the continuation of the market cycle.
This is
way above the danger zone typically characterized by 30% or fewer, implying the risk of cycle ending recession/bear market is remote. The U.S. economy has been regaining momentum after a soft few months. Notable improvements in manufacturing and housing are positives. Global economic indicators are less encouraging, which could continue to suffer should the Omicron variant result in more restrictive behaviours. Fundamentals of the equity markets are very strong with earnings growth gaining momentum. Valuations are decent in most jurisdictions other than the U.S. Canada has also been improving fundamentally.
This doesn’t imply that a corrective phase is not a risk in 2022. In fact, we would argue that after not seeing a correction in 20 months, it is a bit long in the tooth by historical standards. Plus looking at how far markets have advanced, even pre-pandemic times, should raise concerns that we are due for a healthy pullback. A strong market cycle supports the view that any correction would be a buying opportunity.
Is this a new cycle? The bear market in Q1 2020 and brief recession technically ticks the boxes for the end of the market cycle that started in 2009. However, we remain unsure that the last cycle ended. While every cycle is different, typically cycles end with excesses built up in parts of the economy and the subsequent period sees those excesses worked out. The 2020 pandemic-induced bear was caused by an external shock, not due to internal excesses. As a result, there was no work out period, which helps explain the rapid recovery in asset prices and the economy.
Further supporting the view that the bull cycle that started in 2009 may still be intact is the fact that the market/economy of today does not look like it should less than two years into a new cycle.
Central banks starting to tighten, inflation a concern, rampant speculation – these are late-cycle behaviours.
This doesn’t imply the cycle is at risk of ending soon, we have our trusty Market Cycle framework to warn of such an event, but it means we should remain more diligent as this could be year 11 of a cycle, not the carefree year-two environment.
Portfolio positioning
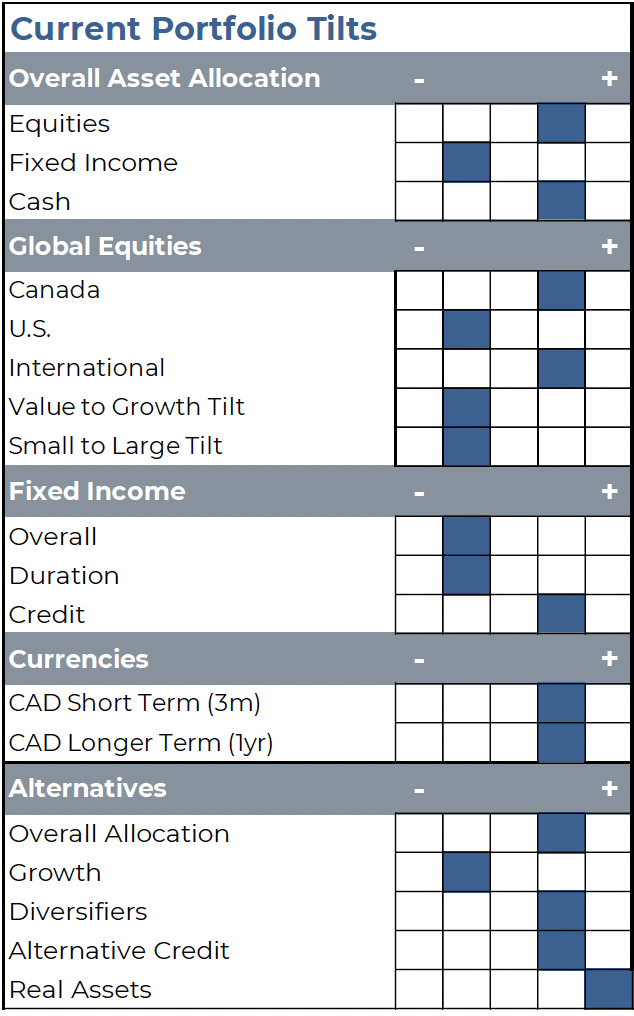
Given the continued strength in Market Cycle indicators, we have not made any material changes to recommended portfolio tilts. Currently we have a mild overweight in equities, which we would like to increase if/when a period of price weakness develops. The dry powder is sitting in cash and fixed income is a mild underweight.
Geographically, we continue to like Canada and International at the expense of U.S. We believe it is still early in a period where value will outperform growth (certainly overdue), which does favour Canada and International relative to the more growth-oriented U.S. equity market. Valuations and trends in forecasts also support this tilt.
We remain with a mild underweight on fixed income, with lighter duration and above-market credit. Yields have pulled back on the back of the Omicron variant. If yields do rise, hopefully as the data continues to improve and the variant fades, we hope to add to duration at higher yields than today. Our view on the CAD has become more positive, given the recent rise in USD. We believe the range of 0.78-0.82 is roughly fair and since we are closer to the 78-cent level, this has us opportunistically trimming U.S. currency.
In the alternative space, we continue to have mild overweight in diversifiers, this helps provide added protection given the underweight in traditional fixed income. Real assets remain the most material overweight in alternatives. This is designed to provide some added portfolio stability should the current elevated risk of inflation continue.
Rising Trends in Asset Allocation
We are all asset allocators, whether it is your personal portfolio, the portfolios of multiple clients, or those managing multi-asset models. The objective is to create a portfolio that has the greatest probability of meeting long-term client objectives given the current market environment and likely path forward. While much of this report so far has been on the big macro trends we see on the horizon, this section discusses a number of rising trends we are seeing within the asset allocation process.
Searching for alternative sources of diversification
— Jason Chen
The benefits of diversification are clear, combine different investments and the portfolio becomes less volatile than the individual components. Unfortunately, as markets have become more interconnected, the correlation between different investments has risen, muting this diversification benefit. And the normal go-to diversifier, namely bonds, appear performance challenged as yields trend higher. In this section, Craig Basinger and Jason Chen, both portfolio managers at Purpose Investments, share their views on finding alternative sources of diversification in today’s world.
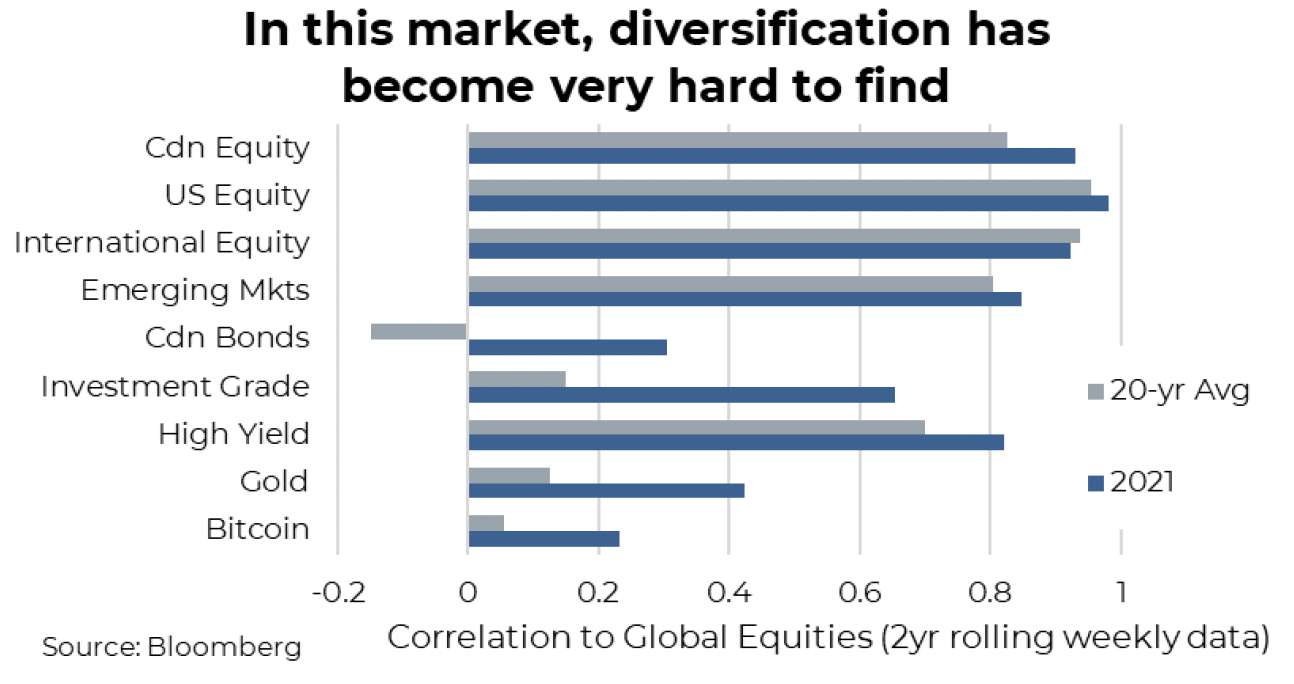
Markets have evolved over the years to become more interconnected, whether because of the speed of news or policy having such an increasing impact on prices, which has created a world where more and more different assets move in a similar fashion, making diversification more challenging.
In the 1990s, the average correlation between major international equity markets was about 0.35—over the past decade, it is 0.65. In same time periods, the Credit Suisse Hedge Fund index correlation to global equities increased from 0.48 to 0.82. Let’s just admit it: diversification was easier in the olden days.
When it is macro forces moving markets, this often trumps fundamentals and other idiosyncratic factors. And there is nothing more macro than a global pandemic. Add to this a very coordinated policy response from just about every nation, we have an economy that contracted and has bounced back. A market that plummeted and recovered, then went on to make a bunch of new record highs. This kind of macro driven environment has been causing the correlations across assets to tighten even more. Even relative to the past decade, correlations have risen during the past year.
2022 will likely see this trend continuing, and investors may rethink their approach to asset allocation. Notably, the role of traditional fixed income, which has been the stable of an investor's portfolio, is diminishing.
Carry and diversification to the equity markets are the top two reasons for a fixed-income allocation. However, the US 10-Year Treasury yields is about 1.5%, well below the current CPI and well below longer-term inflation expectations. The carry is minimal while investors must take on interest rate risks and duration.
Furthermore, the increasing correlation between treasury and equity makes traditional fixed income less effective as a diversifier. The chart below shows the rolling three-month correlation between the two largest ETFs in equity (SPY - SPDR S&P 500 ETF Trust) and fixed income (TLT - iShares 20 Plus Year Treasury Bond ETF). While TLT had a volatile year, its return correlation to SPY fluctuated positively and negatively. Effectively, the long Treasury bond loses its hedge ability to the equity market and is facing upward pressure from inflation at the same time.
Investors cannot rely solely on a fixed-income equity portfolio like the classic 60/40 allocation. Alternative investments (e.g., option strategies, private debt, being more tactical, and structured products) are more and more critical as diversifiers.
The simpler days of just combining equities and bonds to control risk or volatility appear to be over. In this market environment investors must become more creative and search further afield for true portfolio diversifiers.
Positioning for continued energy transition
— Jeremy Lin
The risks from continued climate change to life, the planet and the economy continue to grow and garner more global attention. This thematic is increasingly appearing in portfolios, whether from an ESG perspective or direct investment in companies involved in the energy transformation. In this section Jeremy Lin, the Portfolio Manager of the Purpose Global Climate Opportunities fund, shares his views on the space.
2021 was nothing short of a rollercoaster ride for the climate and energy transition space. At the height of Covid in 2020, people got a glimpse of what the world could look like when (most) governments around the world co-operated in a global lockdown, which inadvertently resulted in massively reduced emissions. But
investors in the space got a rude awakening in February this year that the economics of many high-flying cleantech companies just didn't quite line up with the frothy valuations. With the recent passing of the $1 trillion bipartisan infrastructure bill offering a booster shot to the space, the reconciliation bill is now on deck as the next major regulatory battleground for more spending towards climate resiliency.
When I think about framing my expectation and outlook for how we can achieve net-zero, I distill it down to one simple principle:
supply and demand.
The
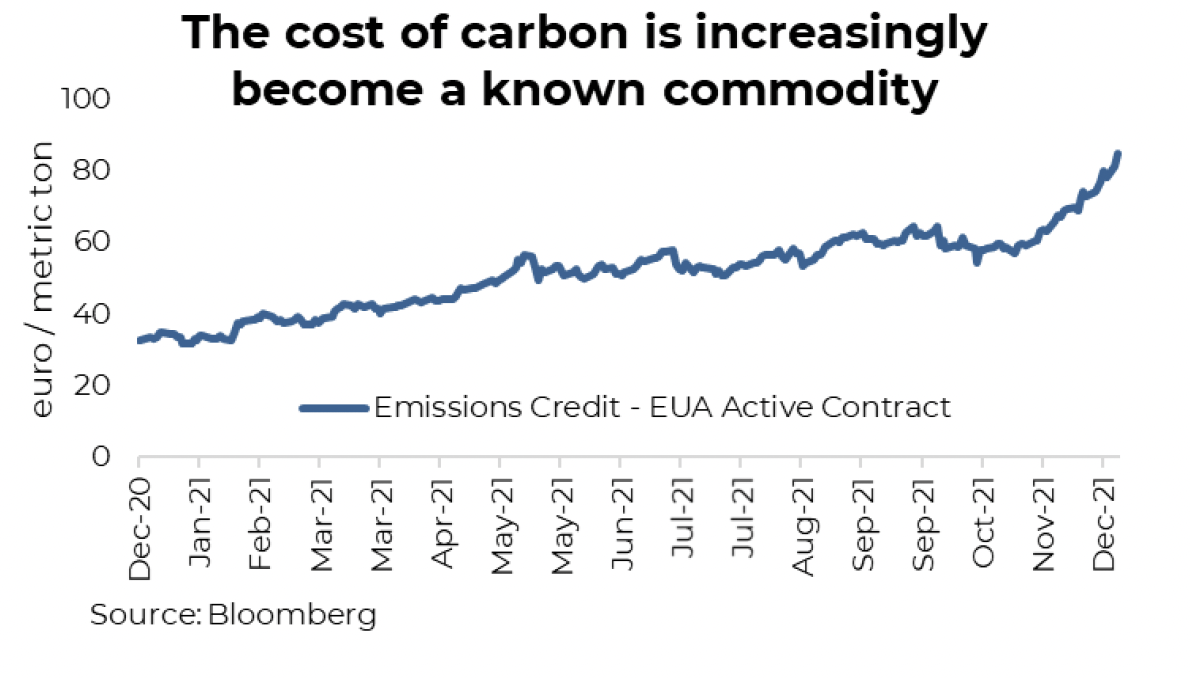
demand side of the energy transition equation is the cost of climate inaction: both the financial and non-financial costs. The financial side is easy: Climate models and history have shown that with rising temperatures, the frequency and severity and natural disasters, like wildfires and hurricanes, will only go up and consequently so will property and casualty-insured losses, which is reported by insurers/reinsurers around the world. Meanwhile, the EU Emissions Trading System (ETS), the world's largest carbon market, has carbon credits trading at all-time highs, which is another quantitative measure that investors can look to as a sign of the increasing cost of climate inaction.
The non-financial side is the tough one. What is the cost of living somewhere with constant heatwaves and rolling blackouts because of wildfire risks, or not being able to heat your home because a severe winter storm takes out key energy infrastructure? You simply can't "bank" your energy needs. Just look at what transpired recently when Vancouver was effectively closed off from the rest of Canada from floods and mudslides. You certainly don't need to be in California or the coastal regions to feel the heat, pun intended.
The
supply side of the equation represents the collective efforts put towards reducing emissions (renewables, cleantech, energy efficiency) offset by anything that increases emissions (heavy transports, cement & steel, fossil fuels). In economics 101, we know that as supply increases, all else equal, the equilibrium clearing price goes down, in this case, the theorical cost of all the negative climate consequences.
The beneficiaries of more capital towards enablers of emission reductions are obvious: traditional renewables like solar and wind are highly economical today with no shortage of investor dollars eyeing the space. As a corollary to this and one that is not often discussed, is that the heavy emitters of today as well as all the industries along the entire emissions spectrum, should also be rewarded comparably for emissions mitigated.
CO2 is fungible: it doesn't matter if it's 1 gigaton of CO2 avoided through building solar farms, or 1 gigaton of CO2 avoided through coal-to-gas conversion—the net climate benefit is effectively the same. While many heavy emitters, especially the oil & gas producers, are painted as the villains with one broad stroke today, I expect investors in 2022 will start looking under the hood to differentiate the good players from the bad when it comes to materially reducing their own emissions, given the substantial rise in energy cost resulting from global economies “decarbonizing our supply quicker than our demand" (paraphrased from one of the key investments thought leaders David Einhorn).
Digging deeper into the supply dynamic, it's important to recognize that the aforementioned "supply" is highly inelastic.
Renewables can't be built overnight no matter how much capital you throw at it today. There is a limitation on infrastructure: in fact, transmission projects could take upwards of seven to ten years depending on the jurisdiction whereas a typical solar/onshore wind farm could be commissioned and built in –two to three years if not shorter. Labour shortage will likely be an on-going theme as workers demand for better pay (and rightly so) in the midst of the on-going Covid situation. Supply chain continuity from the mining and processing operations of critical minerals involved in building the solar panels and batteries will be at the forefront of the energy transition discussion for decades to come. Companies that can enable the infrastructure buildout required for faster renewable adoption or develop a sustainable mining operation for key materials such as lithium and nickel will be the second-derivative winners of the energy transition theme.
In conclusion for investors with the objective of investing for a zero-carbon world in 2022:
1.
Don't forget the big picture: The financial and hidden costs of climate inaction is rising by the day regardless of Covid, the Fed’s actions, or rates.
2. Invest based on
net emission reductions, not just absolute emission reductions.
3.
Look for bottlenecks within every single renewable value chain, from the critical minerals at the source to the infrastructure required.
Defending Your Long-Term Financial Plans from Inflation
— Brett Gustafson
Inflation has been a hot topic over the past year with consumer prices spiking higher. While the transitory or persistence remains an open debate, inflation risk is higher now than it has been. This is a clear risk to long-term financial plans. Ensuring your portfolio has an inflation protection component is increasingly becoming part of the asset allocation process.
We all have a plan for the future, sometimes well articulated, other times more of a loose guide. Many responsible investors will have a financial plan based on various inputs such as return expectations, planned monthly savings, and expenses into retirement. One input has not garnered much attention due to the very consistent nature of the component: inflation. Throw in a 2% assumption, roughly the annual pace over the past three decades, and off you go. Seems like a pretty safe bet, until recently.
Currently, consumer prices are running pretty hot. However, it is safe to say these should come back down as bottlenecks are removed and demand normalizes in the coming quarters. If price increases came back down to 2%, this would have a minimal impact on long-term financial plans. If inflation comes back down but settles out at a higher level for the long term, this is a risk.
A 50-year-old investor who expects their retirement spending needs to be $100,000 per year in today’s dollars 20 year from now should care about the rate of inflation. Historically, with 1.82% inflation, this isn’t so bad, needing to grow their portfolio to provide $143,000 per year.
Now if inflation remains elevated, say at 3.5%, the portfolio would need to fund almost $200,000 per year. To say that difference would throw off your retirement projections would be an understatement. A higher rate of savings while employed and/or a higher rate of return (meaning more risk) are two potential solutions to protect purchasing power. However, there are certain types of investments that have historically acted as a hedge to guard portfolios from inflation risk.
Inflation is clearly a risk for financial plans and, logically, to the long-term real value of a portfolio. With this risk elevated, we are seeing increased demand in portfolio allocations to protect the real purchasing power of the portfolio. These ‘inflation protectors’ are often grouped in a category called ‘real assets’ that tend to have a higher correlation to inflation.
There are many different types of real assets, the primary groupings include real estate, commodities, real return bonds and infrastructure. The efficacy of each group in offsetting inflation varies from one inflationary period to the next or reacts differently because of different kinds of inflation.
Ultimately, adding a diversified-managed product to a portfolio ensures that you are not betting on just one horse within real asset sectors. For example, commodities such as energy, agriculture, and mining might be less sensitive to changes in interest rates as compared with infrastructure simply because of duration. The risk/return profiles of each asset class can vary, which is where the efficiency of the multi-asset solution comes into play towards a client’s objectives and constraints.
To prove some of the added benefits of a real asset portfolio, below is a 15-year weekly table outlining the components discussed in relation to the global equity market. While real estate and commodities might have a lower correlation and beta to the world’s equity market, infrastructure behaves more like an equity. That is because of the challenging environment of infrastructure: a retail investor can typically only invest in infrastructure-linked equities whereas commodities and real estate provide a much different solution, whether it is access to cash flow from real estate or the direct exposure to commodities. Regardless, all components of a well-diversified portfolio have led to less correlation and beta than an equity index would. While real asset components lean towards having a higher interest rate sensitivity initially, they ultimately do provide long-term growth with higher-sustained inflation. In addition, one interesting note is the low correlation each real asset has to each other. Proving that these components will behave differently in changing environments providing diversification along the way.
It is possible to put together your own real asset portfolio, but the challenge is achieving nuanced balance between the many components. Whether its selection, operation, monitoring or taking advantage of opportunities throughout the life of the portfolio, everything needs to work together with a purpose. If you are looking for yield replacement, diversification benefits, inflation correlation, or simply a storage of value, a real assets portfolio can help achieve the goals of financial plans across Canada.
Source: Charts are sourced to Bloomberg L.P. and Purpose Investments Inc.
The contents of this publication were researched, written and produced by Purpose Investments Inc. and are used by Echelon Wealth Partners Inc. for information purposes only.
This report is authored by Craig Basinger, Greg Taylor and Derek Benedet Purpose Investments Inc.
The contents of this publication were researched, written and produced by Purpose Investments Inc. and are used herein under a non-exclusive license by Echelon Wealth Partners Inc. (“Echelon”) for information purposes only. The statements and statistics contained herein are based on material believed to be reliable but there is no guarantee they are accurate or complete. Particular investments or trading strategies should be evaluated relative to each individual's objectives in consultation with their Echelon representative.
Echelon Wealth Partners Ltd.
The opinions expressed in this report are the opinions of the author and readers should not assume they reflect the opinions or recommendations of Echelon Wealth Partners Ltd. or its affiliates. Assumptions, opinions and estimates constitute the author's judgment as of the date of this material and are subject to change without notice. We do not warrant the completeness or accuracy of this material, and it should not be relied upon as such. Before acting on any recommendation, you should consider whether it is suitable for your particular circumstances and, if necessary, seek professional advice. Past performance is not indicative of future results. The comments contained herein are general in nature and are not intended to be, nor should be construed to be, legal or tax advice to any particular individual. Accordingly, individuals should consult their own legal or tax advisors for advice with respect to the tax consequences to them.
Purpose Investments Inc.
Purpose Investments Inc. is a registered securities entity. Commissions, trailing commissions, management fees and expenses all may be associated with investment funds. Please read the prospectus before investing. If the securities are purchased or sold on a stock exchange, you may pay more or receive less than the current net asset value. Investment funds are not guaranteed, their values change frequently and past performance may not be repeated.
Forward Looking Statements
Forward-looking statements are based on current expectations, estimates, forecasts and projections based on beliefs and assumptions made by author. These statements involve risks and uncertainties and are not guarantees of future performance or results and no assurance can be given that these estimates and expectations will prove to have been correct, and actual outcomes and results may differ materially from what is expressed, implied or projected in such forward-looking statements. Assumptions, opinions and estimates constitute the author’s judgment as of the date of this material and are subject to change without notice. Neither Purpose Investments nor Echelon Partners warrant the completeness or accuracy of this material, and it should not be relied upon as such. Before acting on any recommendation, you should consider whether it is suitable for your particular circumstances and, if necessary, seek professional advice. Past performance is not indicative of future results. These estimates and expectations involve risks and uncertainties and are not guarantees of future performance or results and no assurance can be given that these estimates and expectations will prove to have been correct, and actual outcomes and results may differ materially from what is expressed, implied or projected in such forward-looking statements. Unless required by applicable law, it is not undertaken, and specifically disclaimed, that there is any intention or obligation to update or revise the forward-looking statements, whether as a result of new information, future events or otherwise.
Before acting on any recommendation, you should consider whether it is suitable for your particular circumstances and, if necessary, seek professional advice.
The particulars contained herein were obtained from sources which we believe are reliable, but are not guaranteed by us and may be incomplete. This is not an official publication or research report of either Echelon Partners or Purpose Investments, and this is not to be used as a solicitation in any jurisdiction.
This document is not for public distribution, is for informational purposes only, and is not being delivered to you in the context of an offering of any securities, nor is it a recommendation or solicitation to buy, hold or sell any security.