Market openers, ourselves included, have been commenting about rising inflation for a few quarters now and it’s finally started to show up in the consumer price data. Pretty much every price indicator is showing rising prices. This is evident in year-over-year measurements, which are exacerbated by depressed prices a year ago, and if you just look at price changes over the past few months. Core U.S. CPI is up about 1.4% over the past 3-months—that would be 5% annualized if the pace persisted. Year-over-year producer prices are up (+4.1% ex food & energy), with import prices at +11% at exports at +14%. If you were waiting to ‘see the whites of their eyes’ (for inflation, that is), this may be the time.
It is safe to say this spike in pricing data is not a huge surprise. In addition to everyone talking about it for the past six months, bond yields experienced a relatively muted response given the jump in CPI data last week. The U.S. 10-year yield moved a bit higher but didn’t even get close to levels from a month ago. Yields are actually very low given the current inflation data compared to the historical relationship (chart 1). That outlier in the bottom middle of the chart is the current yield and CPI, implying bond yields are way to low given current CPI. This is clear evidence that the consensus believes this inflationary spike will prove temporary and is not pricing much inflation into current bond yields.
Going forward, the big two questions are 1) whether this spike in inflation will prove fleeting and 2) should investors alter their allocations in case inflation does continue.
Is this rise of inflation temporary or something bigger? The case for this uptick in inflation as just a temporary phenomenon is compelling. Many industries were caught off guard by how consumer spending changed during the pandemic to demand more durable goods relative to services and how quickly this spending would recover from the “recession” (in quotations to denote our theory that 2020 may not have been a real recession, but that’s another story). Add logistic challenges that persist and some capacity hiccups due to COVID, the ‘just in time’ supply chains have become ‘in a few months’ supply chains. This combination is especially evident in the commodity space. However, as society re-opens, and spending moves from durables back to services, the demand side of the equation is likely to soften and the supply bottlenecks gradually resolve.
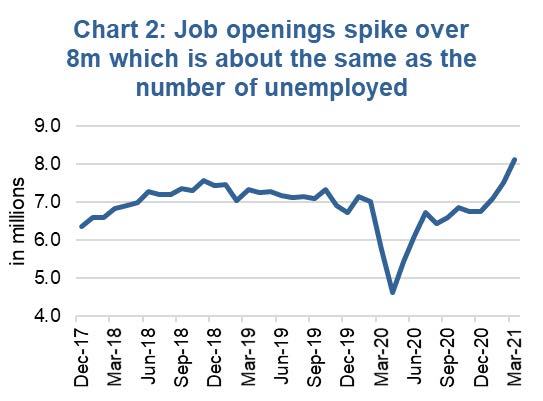
The risk to the above ‘don’t worry about it’ scenario is if inflation starts to show up in wages and future inflation expectations. Wages have remained relatively flat in a rather convoluted labour market. Total U.S. employment is 9 million jobs shy of pre-pandemic levels. Normally that would keep a lot of downward pressure on wages. BUT, job openings at 8.1 million is the highest ever (chart 2, data series goes back 20 years). If this mismatch is due to government support programs disincentivizing some, once those programs decline in the coming months those unemployed will hop into those job openings, resulting in little impact on wages. If this is a skills mismatch, wage pressures are coming. It is likely a combination of both and we believe wages will begin to tick higher, adding to the inflation concerns. As the bottlenecks persist for the coming months / quarters, this inflation uptick is likely to gain momentum.
What can or should investor do? The bond market and equity markets are clearly good at ignoring one month’s data. However, if this rising inflation concern persists over 2, 3, 4+ months, it will likely begin weighing on bonds and portions of the equity markets. Inflation expectations are on the rise which is perhaps the bigger deal now. The University of Michigan inflation survey for 5-10 years just spiked over 3% for the first time since 2011. Companies have increasingly been highlighting or mentioning inflationary pressures during earnings conference calls (chart 3). Inflation is a mindset, and it is starting to creep into the minds of consumers and corporations.
While we do believe this rise in inflation will prove short-term, short-term for inflation can be a number of quarters or over a year. Our base case scenario is a cyclical rise in inflation this year and into next, followed by a central bank response and slowing economy. Further into this decade there are other contributors that could see inflation gaining a stronger footing.
Whether it is to help protect from this cyclical uptick of inflation or the risk of a longer-term risk this decade, there are certain investments that tend to hold up better or even benefit when inflation expectations are on the rise. Using weekly and monthly data over various time periods, we sorted several key markets and equity sectors based on their sensitivities to changing inflation expectations. Generally speaking: Value beats Growth, Small Cap beats Large Cap, International (including Canada) beats US. Among bonds High-Yield beats Investment Grade and the broad bond universe. At the sector level Financials, Consumer Discretionary benefit. Consumer Staples, Telecom and Technology do not. Of course, much depends on the company as well.
The equity markets in general start to see multiple compression when inflation runs over 4%, which is roughly the level today (chart 4). However, if
this does weigh on equities and you agree that this inflation bout is temporary (for now), a sell-off would be a buying opportunity.
Charts are sourced to Bloomberg L.P. unless otherwise noted.
The contents of this publication were researched, written and produced by Richardson Wealth Limited and are used herein under a non-exclusive license by Echelon Wealth Partners Inc. (“Echelon”) for information purposes only. The statements and statistics contained herein are based on material believed to be reliable but there is no guarantee they are accurate or complete. Particular investments or trading strategies should be evaluated relative to each individual's objectives in consultation with their Echelon representative.
Forward Looking Statements
Forward-looking statements are based on current expectations, estimates, forecasts and projections based on beliefs and assumptions made by author. These statements involve risks and uncertainties and are not guarantees of future performance or results and no assurance can be given that these estimates and expectations will prove to have been correct, and actual outcomes and results may differ materially from what is expressed, implied or projected in such forward-looking statements.
The opinions expressed in this report are the opinions of the author and readers should not assume they reflect the opinions or recommendations of Echelon Wealth Partners Inc. or its affiliates. Assumptions, opinions and estimates constitute the author’s judgment as of the date of this material and are subject to change without notice. We do not warrant the completeness or accuracy of this material, and it should not be relied upon as such. Before acting on any recommendation, you should consider whether it is suitable for your particular circumstances and, if necessary, seek professional advice. Past performance is not indicative of future results. These estimates and expectations involve risks and uncertainties and are not guarantees of future performance or results and no assurance can be given that these estimates and expectations will prove to have been correct, and actual outcomes and results may differ materially from what is expressed, implied or projected in such forward-looking statements.
The particulars contained herein were obtained from sources which we believe are reliable, but are not guaranteed by us and may be incomplete. The information contained has not been approved by and are not those of Echelon Wealth Partners Inc. (“Echelon”), its subsidiaries, affiliates, or divisions including but not limited to Chevron Wealth Preservation Inc. This is not an official publication or research report of Echelon, the author is not an Echelon research analyst and this is not to be used as a solicitation in a jurisdiction where this Echelon representative is not registered.
The opinions expressed in this report are the opinions of its author, Richardson Wealth Limited (“Richardson”), used under a non-exclusive license and readers should not assume they reflect the opinions or recommendations of Echelon Wealth Partners Inc. (“Echelon”) or its affiliates.
This is not an official publication or research report of Echelon, the author is not an Echelon research analyst and this is not to be used as a solicitation in a jurisdiction where this Echelon representative is not registered. The information contained has not been approved by and are not those of Echelon, its subsidiaries, affiliates, or divisions including but not limited to Chevron Wealth Preservation Inc. The particulars contained herein were obtained from sources which we believe are reliable, but are not guaranteed by us and may be incomplete.
Assumptions, opinions and estimates constitute the author’s judgment as of the date of this material and are subject to change without notice. Echelon and Richardson do not warrant the completeness or accuracy of this material, and it should not be relied upon as such. Before acting on any recommendation, you should consider whether it is suitable for your particular circumstances and, if necessary, seek professional advice. Past performance is not indicative of future results. These estimates and expectations involve risks and uncertainties and are not guarantees of future performance or results and no assurance can be given that these estimates and expectations will prove to have been correct, and actual outcomes and results may differ materially from what is expressed, implied or projected in such forward-looking statements.
Forward-looking statements are based on current expectations, estimates, forecasts and projections based on beliefs and assumptions made by author. These statements involve risks and uncertainties and are not guarantees of future performance or results and no assurance can be given that these estimates and expectations will prove to have been correct, and actual outcomes and results may differ materially from what is expressed, implied or projected in such forward-looking statements.