Emerging markets (EM) have a very strong allure for inclusion into the international equity component of a portfolio. These markets are generally attached to economies that are in a different stage of development, reacting more to investments than developed economies.
Their demographics are enticing as the growth rates are higher and the percentage of youth tends to be greater than most developed economies. As incomes grow, spending patterns change, driving growth. This lifts an increasing portion of the population into “middle class,” giving them the ability to allocate their spending from basic goods to discretionary items, which can supercharge an economy and its market. EM also reacts differently to many macro trends than developed markets, offering not just better growth prospects, but some level of diversification benefit.
Okay, as most probably know, EM isn’t just rainbows and puppies. These markets can be very volatile—less developed capital markets are much more sensitive to capital flows, and let’s not forget about political risk. EM clearly offers a higher risk/higher reward (potential) subset of global equities. So, while EM has underperformed developed markets (DM) over the past 10 years (refer to the chart above), we remain negative on the space and have no weighting or underweight in our asset allocation framework. Here’s why:
Global Trade – While over the years, EM has changed and become less homogeneous (which is a fancy way to say they don’t all move together as much as they used to), they remain more sensitive to global economic growth and global trade. Or more specifically, they’re sensitive to changes in growth prospects. Global trade typically grows when the global economy grows, which is good for all equities—it’s just that EM is more sensitive to these global trends. This is intuitive given many emerging market nations are exporters or have a higher weighting in resource companies than developed markets. This can be seen in the chart below.
Perhaps more convincing is that over the past 20 years,
the annualized monthly return of EM was +15.9% compared with +8.9% for DM when global trade was growing by 4% or greater.
More importantly, when global trade was growing below 4%, EM annualized returns were down to +1.9% compared with a more reliable +5.5% in DM.
So as goes global trade so goes EM (vs DM). We may be heading to a recession, or at least flirting with one, in the coming quarters, which is not ideal for global trade growth. Plus, global trade got a huge boost coming out of the pandemic as we all spent money on durable goods over services. That is tilting back to normal with services on the rise and durables spending slowing. Those containers on the ships—they are full of durables, not services.
The global trade outlook is not positive for EM.
Earnings Growth –
This may have some overlap with global trade, but the connection or correlation is even stronger so it’s worth noting. Relative forward consensus forecast earnings growth rates between EM and
DM have a strong correlation with the performance of EM vs DM. On a relative basis, whichever market has a higher expected earnings growth rate tends to outperform the other market.
It is less about valuation levels, which typically show EM as cheap vs DM, and more about earnings growth momentum. The bad news for EM is the forward-earnings forecast for the next 12-months has contracted 7% over the past year, while DM earnings growth expectations have fallen but remain positive at 14%. DM earnings growth will continue to come down, but not sure EM earnings have bottomed yet.
Earnings growth is not positive for EM.
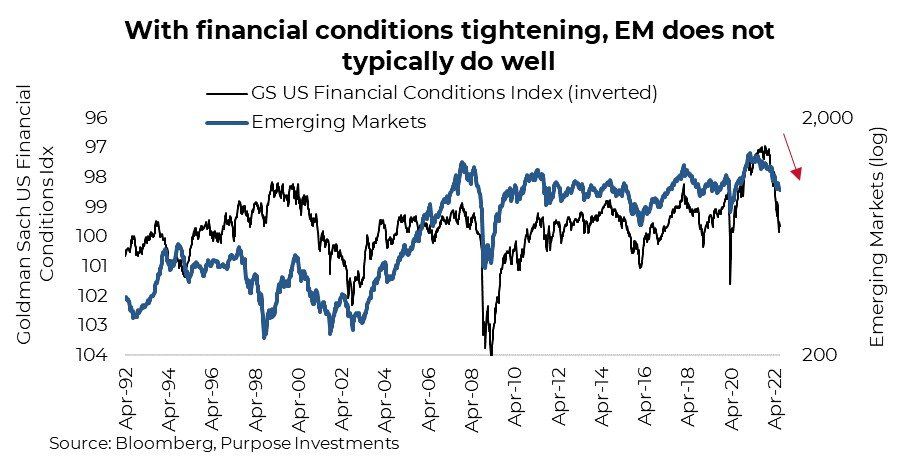
Financial Conditions Tightening – We could debate how far the Fed and other central banks go on this hiking tirade designed to stop inflation, but there is no debate on the fact that financial conditions are on a tightening trajectory. Central bank rates are one ingredient. Considering higher credit spreads, higher yields, a rising U.S. dollar…the list goes on…it’s clear the trend is for tighter conditions.
This can be seen in the chart below using the Goldman Sachs US Financial Conditions index. There is a strong relationship between financial conditions and EM performance. Tighter financial conditions tend to lead to less risk-taking behaviour and more capital flows back to the safety of domestic markets. Given the size of EM, these flows can have a larger and more noticeable impact on markets.
Financial conditions are not positive for EM.
Not now, but maybe soon
For most investor portfolios, EM isn’t a big component. Truth is, the TSX, with its commodity tilt, actually provides some similar characteristics to EM. Maybe think of it like a watered-down proxy.
Given this, our neutral stance on EM is about 5% of a portfolio’s equity allocation, since most Canadian investors have a decent TSX exposure.
Currently we remain underweight or no weight, depending on the mandate’s longer-term objective.
Adding to this negative view is the risk of political instability. Inflation, the war, and high food and energy prices are all impacting EM and developing economies much more than developed markets. In fact, food inflation is often a precursor to unrest (more so in other countries outside the U.S. and Canada that have seen their currencies fall), and food inflation has been material. There have some flareups,
and we may be moving towards a summer of unrest.
This negative view of EM is not static.
We have a long-term view or strategy of adding EM late in a bear or early in a global economic recovery, as that is often the best time. Whatever this economic slowdown becomes, we are clearly not coming out the other side yet.
We would look for a peak in tightening financial conditions, re-acceleration of earnings growth in EM, or signs that the global economy is re-accelerating. Global PMIs provide a good proxy for this, but for now continue to soften.
Investment Implications
Emerging markets, as a rather different sub-set of global equities, certainly have many long-term beneficial characteristics. However, given several macro factors are currently trending in an unfriendly fashion, we do not have a positive view of EM. Yes, valuations are attractive but other factors such as global trade, financial conditions, and relative earnings growth are much better indicators that valuations. This view may change soon, but “soon” is likely measured in quarters not days.
— Craig Basinger is the Chief Market Strategist at Purpose Investments
Source: Charts are sourced to Bloomberg L.P. and Purpose Investments Inc.
The contents of this publication were researched, written and produced by Purpose Investments Inc. and are used by Echelon Wealth Partners Inc. for information purposes only.
This report is authored by Craig Basinger, Chief Market Strategist Purpose Investments Inc.
Disclaimers
Echelon Wealth Partners Inc.
The opinions expressed in this report are the opinions of the author and readers should not assume they reflect the opinions or recommendations of Echelon Wealth Partners Inc. or its affiliates. Assumptions, opinions and estimates constitute the author's judgment as of the date of this material and are subject to change without notice. We do not warrant the completeness or accuracy of this material, and it should not be relied upon as such. Before acting on any recommendation, you should consider whether it is suitable for your particular circumstances and, if necessary, seek professional advice. Past performance is not indicative of future results. The comments contained herein are general in nature and are not intended to be, nor should be construed to be, legal or tax advice to any particular individual. Accordingly, individuals should consult their own legal or tax advisors for advice with respect to the tax consequences to them.
Purpose Investments Inc.
Purpose Investments Inc. is a registered securities entity. Commissions, trailing commissions, management fees and expenses all may be associated with investment funds. Please read the prospectus before investing. If the securities are purchased or sold on a stock exchange, you may pay more or receive less than the current net asset value. Investment funds are not guaranteed, their values change frequently and past performance may not be repeated.
Forward Looking Statements
Forward-looking statements are based on current expectations, estimates, forecasts and projections based on beliefs and assumptions made by author. These statements involve risks and uncertainties and are not guarantees of future performance or results and no assurance can be given that these estimates and expectations will prove to have been correct, and actual outcomes and results may differ materially from what is expressed, implied or projected in such forward-looking statements. Assumptions, opinions and estimates constitute the author’s judgment as of the date of this material and are subject to change without notice. Neither Purpose Investments nor Echelon Partners warrant the completeness or accuracy of this material, and it should not be relied upon as such. Before acting on any recommendation, you should consider whether it is suitable for your particular circumstances and, if necessary, seek professional advice. Past performance is not indicative of future results. These estimates and expectations involve risks and uncertainties and are not guarantees of future performance or results and no assurance can be given that these estimates and expectations will prove to have been correct, and actual outcomes and results may differ materially from what is expressed, implied or projected in such forward-looking statements. Unless required by applicable law, it is not undertaken, and specifically disclaimed, that there is any intention or obligation to update or revise the forward-looking statements, whether as a result of new information, future events or otherwise. Before acting on any recommendation, you should consider whether it is suitable for your particular circumstances and, if necessary, seek professional
advice.
The particulars contained herein were obtained from sources which we believe are reliable, but are not guaranteed by us and may be incomplete. This is not an official publication or research report of either Echelon Partners or Purpose Investments, and this is not to be used as a solicitation in any jurisdiction.
This document is not for public distribution, is for informational purposes only, and is not being delivered to you in the context of an offering of any securities, nor is it a recommendation or solicitation to buy, hold or sell any security.