The long term or secular reasons to have an emerging market (EM, or developing market, if you prefer) allocation within a portfolio are pretty sound. We’ve all likely heard them before: the demographics are better, the economic growth is faster, and both equity and debt offer a different risk/return profile compared with developed markets.
Unfortunately, over the past decade, that different risk/return profile of EM equities has resulted in muted returns with lots of risk. During that time, EM equities have grown at about 4% compared with almost 12% for global developed markets (DMs).
Truth be told, if you looked at the decade before the last decade it was literally the opposite story. EMs crushed it in the early 2000s compared with DMs. So what does the next decade hold or even the next few quarters or years?
Some good, some bad
Historically, much of the relative performance of EMs can be explained by a number of key macro factors. In this section, we will go through a few of them, including expectations on the next move.
Valuations (good)
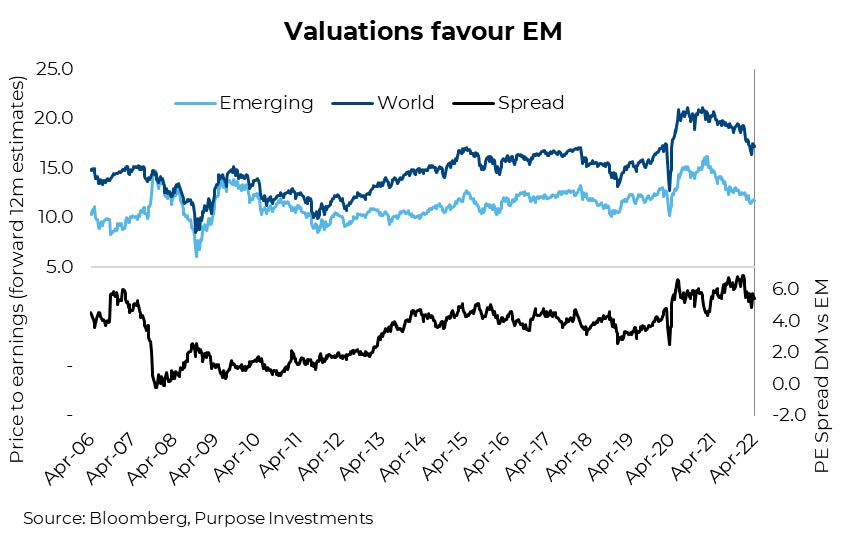
– It is more common for EMs to trade at a valuation discount to DMs. The risks are greater from a currency, political, growth-sensitivity, or flows perspective. That being said, with DM trading at 17.2x forward estimates and EM trading at 11.8x, the spread is on the high side of historical levels.
To add some context, the valuations between EMs and DMs were almost equal from 2007 to 2010, during the final stages of the commodity super cycle. So with commodity prices just about as elevated today, why has the valuation spread not narrowed? Well, EM is now more China and technology tilted than 15 years ago and much less commodity sensitive. Still, that is a widespread that does support EM.
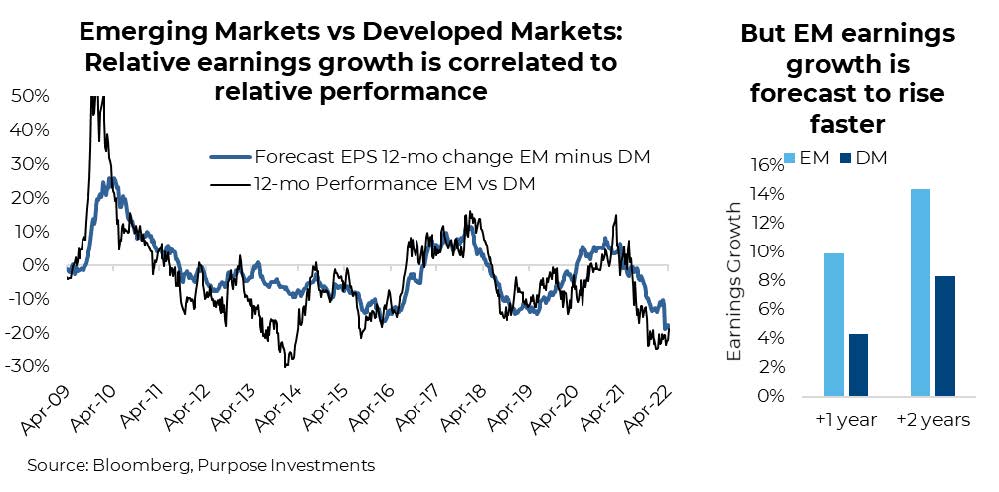
Earnings growth (good) – When earnings growth is strong, and rising faster in EMs than DMs, EMs tend to outperform. When earnings growth slows or goes negative, DMs perform better. In a world where there is lots of earnings, risk appetites tend to be greater, and this helps EMs.
When earnings growth is scarce, there is greater safety in DMs.
This explains much of the underperformance of EMs over the past decade as earnings growth in DMs has simply been stronger. You can see this as the purple line in the following graph is below zero for much of the period. However, based on current consensus estimates, EM earnings growth is now poised to surpass DM earnings growth, which has been slowing. In the next 12-months, EM earnings growth is forecast at about 10% compared with only 4% for DMs. This does favour EMs.
Financial conditions (bad) – When the world is experiencing tightening financial conditions, EMs tend to suffer more.
There is a decent relationship between relative EM and DM performance and U.S. yields, the direction of Fed policy, and the direction of the U.S. dollar. Or we can use the Goldman Sachs US Financial Conditions Index as a proxy of many factors. In fact, this is not relative performance to DMs, it is just EM performance.
Given the Fed is on the path to raise rates, yields have moved higher, and quantitative easing (QE) is giving way to quantitative tightening, I think it is safe to say we are going to see more financial tightening in the months ahead.
Not your dad’s emerging markets
It is important to understand that EM universe today is nothing like that of the 90s or even early 2000s. Countries within the universe have gone on various paths of development, with different resources and dynamics.
Decades ago (aka your dad’s EMs), the space was dominated by commodity-producing nations and economies leveraging cheap labour to make stuff for your dad’s kids (that is you). Today’s EM is dominated by Asia, with a heavy technology tilt. Taiwan Semi, Tencent, Samsung, and Alibaba are the biggest names. China, Taiwan, and India comprise about two-thirds of the country allocations across most broad EM ETFs.
This changing composition may lessen some of the previously highlighted performance relationships and it certainly adds some new twists. At the moment, EM’s fate is dominated by the outlook for China. As the country has cracked down on some aspects of technology and continues to suffer from the real estate fallout of Evergrande,
as goes China, so goes EM.
Investment Implications
Across our multi-asset portfolios, within the equity allocation we hold between 4-5% in EMs (based on balanced portfolio). For us, this is roughly a neutral allocation. We are encouraged by the earnings growth outlook and how beaten up the space has become. There’s still lots of political risk, especially within China, but the depressed share prices provide a level of safety. Our biggest concern is the tightening financial conditions, with the note perhaps this is not as strong a driver as it used to be.
Short term, we do believe tech is a bit oversold globally. Should we get a summer bounce, this should lift EM as well given its technology weight. That may create the opportunity to trim as recession risks are likely to rise as time passes and higher yields bite the global economy. Good rule of thumb, the best time to go heavy on EMs is often coming out of recessions.
Source: Charts are sourced to Bloomberg L.P. and Purpose Investments Inc.
The contents of this publication were researched, written and produced by Purpose Investments Inc. and are used by Echelon Wealth Partners Inc. for
information purposes only.
This report is authored by Craig Basinger, Chief Market Strategist, Purpose Investments Inc.
The contents of this publication were researched, written and produced by Purpose Investments Inc. and are used herein under a non-exclusive license by Echelon Wealth Partners Inc. (“Echelon”) for information purposes only. The statements and statistics contained herein are based on material believed to be reliable but there is no guarantee they are accurate or complete. Particular investments or trading strategies should be evaluated relative to each individual's objectives in consultation with their Echelon representative.
Echelon Wealth Partners Ltd.
The opinions expressed in this report are the opinions of the author and readers should not assume they reflect the opinions or recommendations of Echelon Wealth Partners Ltd. or its affiliates. Assumptions, opinions and estimates constitute the author's judgment as of the date of this material and are subject to change without notice. We do not warrant the completeness or accuracy of this material, and it should not be relied upon as such. Before acting on any recommendation, you should consider whether it is suitable for your particular circumstances and, if necessary, seek professional advice. Past performance is not indicative of future results. The comments contained herein are general in nature and are not intended to be, nor should be construed to be, legal or tax advice to any particular individual. Accordingly, individuals should consult their own legal or tax advisors for advice with respect to the tax consequences to them.
Purpose Investments Inc.
Purpose Investments Inc. is a registered securities entity. Commissions, trailing commissions, management fees and expenses all may be associated with investment funds. Please read the prospectus before investing. If the securities are purchased or sold on a stock exchange, you may pay more or receive less than the current net asset value. Investment funds are not guaranteed, their values change frequently and past performance may not be repeated.
Forward Looking Statements
Forward-looking statements are based on current expectations, estimates, forecasts and projections based on beliefs and assumptions made by author. These statements involve risks and uncertainties and are not guarantees of future performance or results and no assurance can be given that these estimates and expectations will prove to have been correct, and actual outcomes and results may differ materially from what is expressed, implied or projected in such forward-looking statements. Assumptions, opinions and estimates constitute the author’s judgment as of the date of this material and are subject to change without notice. Neither Purpose Investments nor Echelon Partners warrant the completeness or accuracy of this material, and it should not be relied upon as such. Before acting on any recommendation, you should consider whether it is suitable for your particular circumstances and, if necessary, seek professional advice. Past performance is not indicative of future results. These estimates and expectations involve risks and uncertainties and are not guarantees of future performance or results and no assurance can be given that these estimates and expectations will prove to have been correct, and actual outcomes and results may differ materially from what is expressed, implied or projected in such forward-looking statements. Unless required by applicable law, it is not undertaken, and specifically disclaimed, that there is any intention or obligation to update or revise the forward-looking statements, whether as a result of new information, future events or otherwise.
Before acting on any recommendation, you should consider whether it is suitable for your particular circumstances and, if necessary, seek professional advice.
The particulars contained herein were obtained from sources which we believe are reliable, but are not guaranteed by us and may be incomplete. This is not an official publication or research report of either Echelon Partners or Purpose Investments, and this is not to be used as a solicitation in any jurisdiction.
This document is not for public distribution, is for informational purposes only, and is not being delivered to you in the context of an offering of any securities, nor is it a recommendation or solicitation to buy, hold or sell any security.