This is not about the authors favorite milk,
naturally that is Earth’s Own unsweetened almond milk [technically it is a beverage due to the political clout of dairy cows, but it is milk to me]. The 2% is actually about the U.S. 10-year Treasury yield breaching this threshold for the first time since mid 2019. Yes, the way back before Covid. In 2019 yields were falling, the Fed had recently finished a two year long rate hiking cycle (8x25bp hikes in total) and the U.S. economic leading indicators were flat lining. The economy was slowing and inflation (U.S. core CPI) was a paltry 2.0%. Yields kept falling and were then crushed by the pandemic.
Fast forward to today, we have a global economy that is growing at a pace well above norms. Global production bottlenecks caused by the strong resurgence of demand and issues with supply chains. And it was the Consumer Price Index (CPI) print for January that helped push the longer-term yield
over 2.0%.
U.S. CPI rose 0.6% in January, roughly the same pace of inflation as December and about the average over the past year. Clearly more persistent than passing. There is some good news but mostly bad news in this month’s data. Some of the previous drivers of CPI have started to stabilize or come back down, which is good news. Plus much of the rise can still be attributed to durable goods, which are still experiencing demand/supply mismatches. However, higher prices are now being seen across most categories. Or in other words it is spreading.
None of this should be much of a surprise, demand dynamics remain and supply is still struggling in certain areas [omicron didn’t help]. Inflation is likely going to remain a hot topic throughout 2022, if not beyond. And there are a few key questions, of which the answers will have an impact on the markets.
Path for the demand / supply imbalance?
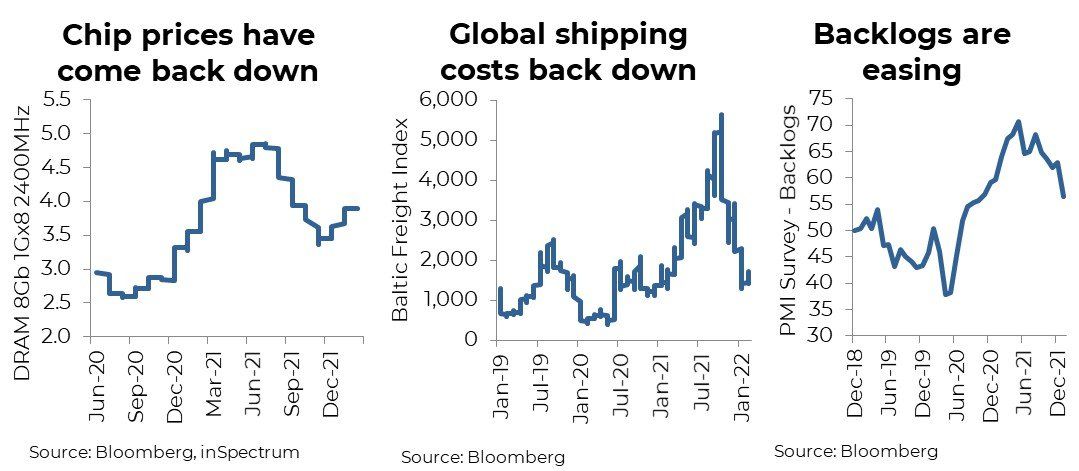
The answer to this one is pretty optimistic. As we all know, our spending patterns changed abruptly during the past few years and supply chains / logistics are stills struggling to adjust. Add in some Covid issues, takes even longer. But if you look a bit further up the supply chain, things have been improving. There are still shortages in chips, but given the price has come back down does indicate things are improving. Global container shipping costs have come crashing back down. And manufacturing survey data does support that backlogs are easing. Or just ask a friend who has purchased a new car, it may have been delayed but has likely arrived.
This is evidence the supply chain is catching up. And, assuming the broader re-opening continues to gain traction, the shift from durable goods to service spending that has already started may well accelerate. If this happens we could very well be talking about too many goods in a year or two.
Are inflationary mindsets changing?
Higher prices are manageable from an overall market / economic perspective, if buyers and sellers view them as temporary or caused by the pandemic imbalances. Higher prices become an issue when people start believing the pace of price increases will continue for a much longer period of time. Do I buy that TV today? If I wait, it will be more expensive? Do I demand a higher wage, not based on my output or contribution, but given the rising cost of living? This mindset changes behaviors and that can be economically dangerous.
Wages have started to rise. Still difficult to conclude this is from a changed mindset or yet another demand / supply imbalance caused by the pandemic. Probably more the latter for now. The economy is expanding, companies are trying to meet rising demand, profits are up, productivity is up, companies appear willing to pay up. The chart below shows U.S. wage growth running at about 5%, the highest since the late 1990s early 2000s. Labour is in the drivers seat at the moment. We would note that the NFIB small business survey on compensation plans, which has a history of leading wage changes, may have peaked and rolled over. Next few months may be key as this survey does wobble about.
What does it mean for markets?
The path is not known for any of the aforementioned macro forces, as we know things can change pretty quickly. However, at the moment, these changes are afoot and that will impact the more market-related trends. Below we have highlighted a number that we believe have portfolio construction implications.
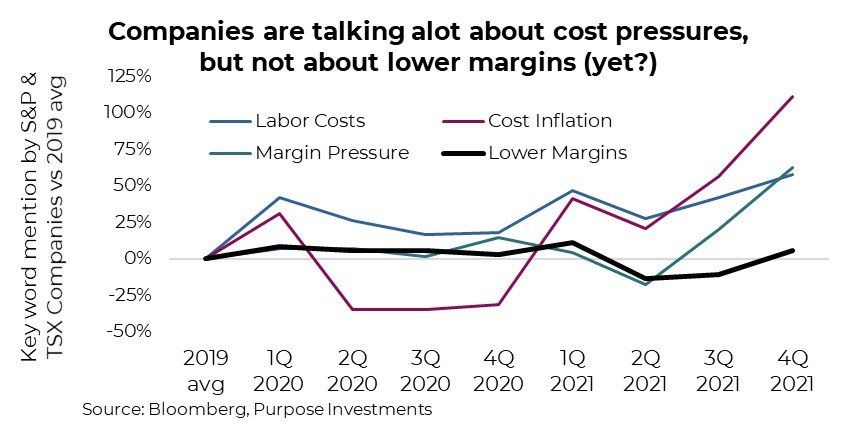
To dig a little deeper into the mindset of people, or more apply the people running companies, we turned to some natural language processing. Scrubbing earnings calls, research, presentations, company filings for TSX and S&P 500 member companies, looking for key words or synonyms, we see what is on their minds. For a baseline, we used the average frequency of key words in 2019. Companies are clearly struggling with ‘cost inflation’ which fell during the depths of the pandemic in 2020 and has been steadily rising (chart below). Labour costs have been rising as well. Most interesting has been mention of margin pressure, a recent increase. Higher costs certainly hurt margins but a stronger economy and rising prices help margins. Companies are mentioning margin pressure but mention of lower margins has not followed. Coming quarters will be crucial if this ‘talk’ translates into actual margin issues.
Broadly speaking, safe to say higher costs and now margin pressures are on the minds of corporations.
Will break-evens move?
We can all cite anecdotes of having to pay more for something that used to cost less. Gawk at headline CPI data that hasn’t been seen in a long time. But given the ambivalence shown in longer term break-evens, the bond market continues to say this will pass. Perhaps because of the mountain of debt accumulated during this pandemic (which is disinflationary), or demographics, or technology. Or it is a learned response developed during careers spent in a low inflationary world. Any previous upticks faded.
In the 1980s and early 1990s, bond traders didn’t believe the central banks could tame inflation. Any rise in the inflation data was expected to continue to rise and potentially spiral. Thirty years later, these aggregate beliefs have reversed. We learn from our personal experiences or history and form pretty strong beliefs. Perhaps we are all more Pavlovian than we think.
At the moment, the market is saying this will pass. Inflation break-evens past the next year have actually been coming down over the past few months. The path of these longer term break-evens matter much more for markets than does the one year or CPI data.
Investment Implications
We remain in our previous camp – bond yields will trend higher but we may have already experienced most of the move. The CPI headline data will come down materially this year, reducing the quantity of ‘inflation talk’. But inflation will remain elevated compared to the past decade. While this is our base case, the variability of scenarios is much greater today than in years past. Or in other words, inflation risk is now with us.
Continue to believe tilting towards value will perform better than growth in this elevated inflationary world. Real assets or other investments that can hold onto purchasing power should remain a portfolio construction consideration. We would also point out that given the TSX’s resource, infrastructure, real estate exposure, it is one of the more ‘real’ markets available to investors.
Source: Charts are sourced to Bloomberg L.P. and Purpose Investments Inc.
The contents of this publication were researched, written and produced by Purpose Investments Inc. and are used by Echelon Wealth Partners Inc. for information purposes only.
This report is authored by Craig Basinger, Chief Market Strategist, Purpose Investments Inc.
The contents of this publication were researched, written and produced by Purpose Investments Inc. and are used herein under a non-exclusive license by Echelon Wealth Partners Inc. (“Echelon”) for information purposes only. The statements and statistics contained herein are based on material believed to be reliable but there is no guarantee they are accurate or complete. Particular investments or trading strategies should be evaluated relative to each individual's objectives in consultation with their Echelon representative.
Echelon Wealth Partners Ltd.
The opinions expressed in this report are the opinions of the author and readers should not assume they reflect the opinions or recommendations of Echelon Wealth Partners Ltd. or its affiliates. Assumptions, opinions and estimates constitute the author's judgment as of the date of this material and are subject to change without notice. We do not warrant the completeness or accuracy of this material, and it should not be relied upon as such. Before acting on any recommendation, you should consider whether it is suitable for your particular circumstances and, if necessary, seek professional advice. Past performance is not indicative of future results. The comments contained herein are general in nature and are not intended to be, nor should be construed to be, legal or tax advice to any particular individual. Accordingly, individuals should consult their own legal or tax advisors for advice with respect to the tax consequences to them.
Purpose Investments Inc.
Purpose Investments Inc. is a registered securities entity. Commissions, trailing commissions, management fees and expenses all may be associated with investment funds. Please read the prospectus before investing. If the securities are purchased or sold on a stock exchange, you may pay more or receive less than the current net asset value. Investment funds are not guaranteed, their values change frequently and past performance may not be repeated.
Forward Looking Statements
Forward-looking statements are based on current expectations, estimates, forecasts and projections based on beliefs and assumptions made by author. These statements involve risks and uncertainties and are not guarantees of future performance or results and no assurance can be given that these estimates and expectations will prove to have been correct, and actual outcomes and results may differ materially from what is expressed, implied or projected in such forward-looking statements. Assumptions, opinions and estimates constitute the author’s judgment as of the date of this material and are subject to change without notice. Neither Purpose Investments nor Echelon Partners warrant the completeness or accuracy of this material, and it should not be relied upon as such. Before acting on any recommendation, you should consider whether it is suitable for your particular circumstances and, if necessary, seek professional advice. Past performance is not indicative of future results. These estimates and expectations involve risks and uncertainties and are not guarantees of future performance or results and no assurance can be given that these estimates and expectations will prove to have been correct, and actual outcomes and results may differ materially from what is expressed, implied or projected in such forward-looking statements. Unless required by applicable law, it is not undertaken, and specifically disclaimed, that there is any intention or obligation to update or revise the forward-looking statements, whether as a result of new information, future events or otherwise.
Before acting on any recommendation, you should consider whether it is suitable for your particular circumstances and, if necessary, seek professional advice.
The particulars contained herein were obtained from sources which we believe are reliable, but are not guaranteed by us and may be incomplete. This is not an official publication or research report of either Echelon Partners or Purpose Investments, and this is not to be used as a solicitation in any jurisdiction.
This document is not for public distribution, is for informational purposes only, and is not being delivered to you in the context of an offering of any securities, nor is it a recommendation or solicitation to buy, hold or sell any security.