Challenges ahead
— Greg Taylor
September has once again lived up to its reputation for volatility. In many ways this had to be expected as equity markets have experienced one of the longest runs of stable returns and minimal drawdowns in history. However, the timing of this recent volatility should not surprise many, as most of the positive tailwinds that have carried the market to these levels are starting to fade away, setting up what could be a difficult period for capital markets.
Global central banks are the biggest and most important factor that have helped elevate recent returns. To their credit, they learned from the mistakes of the global financial crisis where indecision and delay exacerbated things—this time, right from the beginning, the banks did everything they could to help the markets and the economy. But all good things must come to an end, and 18 months after the start of the pandemic, it is time for central banks to begin to remove some emergency measures.
This isn’t a bad thing at all. Central banks need to begin to normalize policy to prepare for the next crisis. But it is a change from the recent normal and means that central banks may be less accommodating for the next while. This action resulted in bond yields moving higher across the curve and has led to a change in sector leadership.
The growth/value trade has been a subject of much debate over the last few years. As growth has dominated in a period of ever lower bond yields, with the threat of inflation, has this turned? Will the rally in energy be the trigger to get this going once again? The energy sector was a victim of the climate movement, but the resulting cuts to production may be setting us up for a bull market in the commodities as we are already seeing shortages in both natural gas and heating oil. The resulting price increases is also adding further ammunition to the inflation argument as higher costs will undoubtably flow through to the price of goods.
What no one really expected in the month was the China risk. Consistently over the last year, China has been working to extend their influence over the capital markets, which has caused many to question if China is at all investible? Their constant clamp down on social media and other growth sectors became a secondary concern as their largest construction company ran into liquidity issues. Evergrande was never going to be a Lehman moment, but it had the potential to leave some scars. For the moment, this risk has faded to the background, but it can’t be ignored and has the potential to flare up once again.
What could prove to be the biggest risk to the markets in the near term is earnings season. With the advent of quant funds gaining a greater market share, we have seen companies that beat earning expectations gain versus those that don’t. But as easy comparable estimates fade, huge beats will be harder to achieve. We have already seen some notable companies miss these expectations and the risk is that the next month will be filled with negative earnings revisions.
One of the biggest reasons for earning misses has been from broken supply chains. Covid lockdowns and pulled-forward demand for goods did immeasurable damage to the concept of ‘just-in-time’ inventory models. Companies continue to scramble for components, such as semiconductors, in order to product goods. As indicated by the surge in used car prices, the automotive sector has been one of the hardest hit. Until this is fixed, we must expect inflated prices of goods and services and squeezing margins. Whether this is temporary or permanent is still up for debate, but its another headwind to markets.
The year has already been a huge success for many investors as markets are near all-time highs, but with supportive measures being pulled back and the risk of earnings disappointments, the risk/reward going forward is looking less attractive than it has in past months. Markets have been due for a correction or volatility for a while. However, this is by no means the end. There remain record amounts of ‘un-risked capital’ that is looking to be allocated and buy the dip. Investors should be prepared for a pullback, but also be aware that these are opportunities. As a famous investor once said, “the stock market is the only store in the world that when things go on sale, buyers run away screaming.”
Market Cycle – good but weaker than before
— Craig Basinger
In any given month, there is a greater likelihood that markets will go higher, and the economy will expand. And while there are periods of equity market weakness during economic expansions, these tend to be corrections or temporary pullbacks that often provide excellent buying opportunities to put money to work. However, if the economy moves into a recession or one is nearing, then the pullback in the equity market is likely not a buying opportunity, but instead a trap for investors buying the dip.
Therefore, to be a more successful investor there are three key ingredients: 1) during most periods, maintain your ideal allocation that’s designed to have the highest probability of reaching your long-term goals; 2) use periods of market weakness that do not coincide with a recession as buying opportunities; and 3) reduce market exposure if the prospect of a recession is elevated.
The difficult aspect is a recession only becomes known months or even quarters after it has started. Clearly, way too late to provide any benefit to the investment or asset allocation process. The Market Cycle framework is a multi-factor, multi-discipline approach that attempts to answer the big question: is a recessionon the horizon? The framework uses a basket of economic, fundamental, and yield/credit indicators that have historically been good predictors of recessions. Complicating matters, every recession is different and as a result some indicators work in some cycles and some in others.
There is no one magic indicator. By combining a diversified basket of indicators, we believe this offers investors a non-emotional lens to gauge if recession risks are elevated or dormant to help guide asset-allocation decisions in calm markets and during periods of market weakness.
Markets hit some volatility
Equity markets have once again experienced some weakness during September, a seasonally volatile month. And while markets are down a bit, the standard question during any period of weakness is whether this is the start of something worse or if it’s a potential buying opportunity. For us, it meant good timing for sharing our Market Cycle framework, whether you are already familiar with this idea or this is a new concept.
We categorize our market cycle indicators into four broad categories:
- Rates,
- The U.S. economy,
- The global economy, and
- Fundamentals.
Rates incorporate the activity of central banks around the world, and whether they are tightening or loosening monetary policy. It also incorporates the slope of the yield curve and its changing shape. At the moment, some central banks have started to tighten, which is a negative. However, the yield curve has steepened of late with the uptick in yields—a positive.
The U.S. economy has the most signals, which can be further broken down into two broader economic signals: manufacturing and housing.
Just about every recession in the U.S. can be traced back to weakness in either housing or manufacturing, given the size of the industries and their cyclicality.
Broadly speaking, the U.S. economy remains in good shape (many more bullish signals than bearish). However, there signals were stronger a few months back as some weakness has surfaced, mainly in housing.
The global economy has seen more deterioration of late and is now evenly split with four bullish and four bearish signals. Further evidence is in the trend from last month, which saw six signals deteriorate and only two improve. A slow down in China is having a broader impact on the global economy as is the recent delta variant wave.
To finish the market cycle indicators on a positive note, fundamental remains encouraging. All signals are bullish except valuations in the U.S. Earnings growth is slowing as well in the U.S. International shows the best with all bullish signals and a majority of improvements over last month.
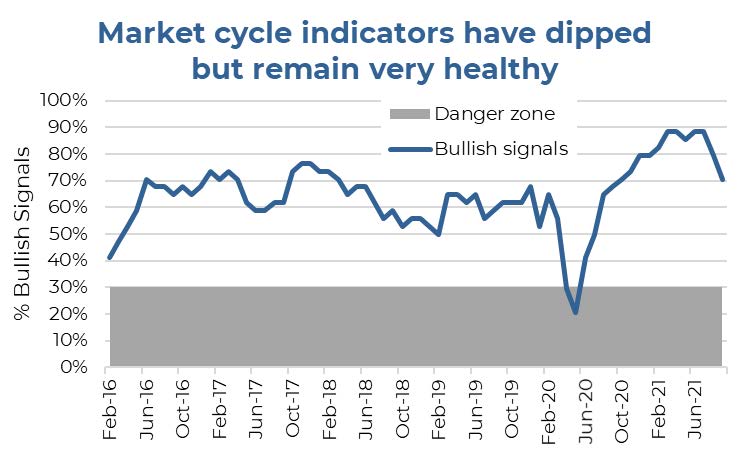
The good news is that while the percentage of bullish signals have dipped from very elevated levels, they remain well above what we call the danger zone. Historically, when bullish signals have dropped down below about 30%, there is often a recession that has started or is on the horizon. As a result, if this period of market continues and the bullish signals remain healthy, this could be a buying opportunity.
If a buying opportunity, the next question is how far will markets pull back. For that we turn to shorter-term sentiment and technical insights.
Market Stresses Build
— Derek Benedet
There has been a not-so-subtle shift in market sentiment the past month. Gone is the perpetual enthusiasm surrounding reopening and the other side of this pandemic. Instead, hawkish bankers are making headlines and other exogenous market issues are creeping into the narrative such as the supply chain woes, inflation, and of course the Chinese property market. Irrespective of the fact that the Evergrande predicament turned out to be more of an Ever-petite moment, it’s difficult to separate each new concern and the impact on the market. Then again, we should remember that its usually markets that make the news, not the other way around.
The upward trend that has gone on since March 2020 is showing signs of stress. Momentum indicators have deteriorated as has trend strength. Over the past 18 months, there have been no technical corrections, which is defined as a 10% decline from previous highs. Few years pass without this claim to fame. The streak of 462 days without being in correction territory should alone cause investors to prepare for potential market volatility. Then again, how many times have you heard over the past year, “the market is due for a correction?” We don’t think this is a case of the boy who cried wolf. A number of market internal indicators have been eroding, increasing the risk of a correction or longer risk-off period for the markets.
The Covid crisis rally has so far eclipsed the rally following the great financial crisis. The chart below plots the preceding three months prior to the eventual bottom and the resulting rally. Thus far, it’s been a smooth ride that has lasted longer and risen faster than back in 2009 and 2010. The Covid rally has yet to face a meaningful slow down or even what we would characterize as normal market behaviour. The transition to the mid-cycle of a bull market historically means choppier markets. Add on the looming taper and you have the type of state that breeds investor uneasiness. Though September has not resulted in any sustained violent sell-off, it has produced some of the worst trading days in months and a slew of technical warnings signs.
A look at investor sentiment
Market cycles drive asset prices to extremes in both directions. The psychology of all investors can move quickly from extreme pessimism and fear to hope, overconfidence, and greed. Though there is no precise way to measure an investor’s state of mind, taking a look at the weekly survey from the American Association of Independent Investors is one of the longest running and most widely followed ways to get a sense of what investors are thinking.
The survey’s bullish bias has slowly been declining for months and the spread between the bulls and the bears has declined to its lowest level since last fall. Though sentiment has fallen steeply recently, it has yet to flash what we would characterize as a contrarian buying signal. Typically, we like the difference between bulls and bears to fall to a level greater than -20. It can be noisy week to week, which is why it is good to add a moving average to reduce the noise. Historically, when the net difference is negative, it’s a positive sign for future returns. This is just one piece of the sentiment picture, but one that we like to keep an eye on. Weak sentiment does not mean we can avoid a drawdown event. A full sentiment unwind would take time to play out and won’t happen in just a couple of weeks.
An overview of market breadth
Trends of investor confidence are responsible for price movements. A market’s breadth, or internal strength, measures the extent of the current emotional state on the markets. As much can be hidden behind an index level, it’s best if stocks are advancing on a broad front. Enthusiasm is no longer as dispersed as it was earlier this year. Given current breadth readings, it’s hard to say that the widely favourable view on stocks is pervasive. The fewer the number of stocks moving in the direction of the major averages, the greater the probability of an imminent reversal in trend. These divergences can run for a prolonged period, but they always end at some point.
It’s a narrowly advancing stock market compared with earlier this year. The NYSE advance/decline line has yet to catch up to the peak in early June. Similarly, the percentage of stocks trading above their 200-day moving average has fallen steadily over the past four months to a current reading of just over 50%.
Approximately 52% of members of the S&P 500 are trading 10% below their highs—hardly the type of broad-based support to propel markets meaningfully higher into the end of the year. In its heart, the market is a mean-correcting mechanism. It doesn’t continually rise in a straight direction. Since the March 2020 Covid low, the S&P 500 has rallied from 2,200 to 4,500 with only a few periods of pause. Even a moderate correction at this point would bring it back to 4000, well within the confines a continued bull market without a major technical breach. With pre-Covid highs now 25% below current levels, it is perfectly normal to feel a sense of uneasiness with this air-pocket as support. There are many villains that could be a trigger for a correction ranging from yields, Fed tapering, inflation, economic data, a tough earnings season, or its just time. Regardless of the reason, the current conditions surrounding trend strength, sentiment and breadth continue to point to a heighted risk of a correction.
Charts are sourced to Bloomberg L.P. unless otherwise noted.
The contents of this publication were researched, written and produced by Richardson Wealth Limited and are used herein under a non-exclusive license by Echelon Wealth Partners Inc. (“Echelon”) for information purposes only. The statements and statistics contained herein are based on material believed to be reliable but there is no guarantee they are accurate or complete. Particular investments or trading strategies should be evaluated relative to each individual's objectives in consultation with their Echelon representative.
Forward Looking Statements
Forward-looking statements are based on current expectations, estimates, forecasts and projections based on beliefs and assumptions made by author. These statements involve risks and uncertainties and are not guarantees of future performance or results and no assurance can be given that these estimates and expectations will prove to have been correct, and actual outcomes and results may differ materially from what is expressed, implied or projected in such forward-looking statements.
The opinions expressed in this report are the opinions of the author and readers should not assume they reflect the opinions or recommendations of Echelon Wealth Partners Inc. or its affiliates. Assumptions, opinions and estimates constitute the author’s judgment as of the date of this material and are subject to change without notice. We do not warrant the completeness or accuracy of this material, and it should not be relied upon as such. Before acting on any recommendation, you should consider whether it is suitable for your particular circumstances and, if necessary, seek professional advice. Past performance is not indicative of future results. These estimates and expectations involve risks and uncertainties and are not guarantees of future performance or results and no assurance can be given that these estimates and expectations will prove to have been correct, and actual outcomes and results may differ materially from what is expressed, implied or projected in such forward-looking statements.
The particulars contained herein were obtained from sources which we believe are reliable, but are not guaranteed by us and may be incomplete. The information contained has not been approved by and are not those of Echelon Wealth Partners Inc. (“Echelon”), its subsidiaries, affiliates, or divisions including but not limited to Chevron Wealth Preservation Inc. This is not an official publication or research report of Echelon, the author is not an Echelon research analyst and this is not to be used as a solicitation in a jurisdiction where this Echelon representative is not registered.
The opinions expressed in this report are the opinions of its author, Richardson Wealth Limited (“Richardson”), used under a non-exclusive license and readers should not assume they reflect the opinions or recommendations of Echelon Wealth Partners Inc. (“Echelon”) or its affiliates.
This is not an official publication or research report of Echelon, the author is not an Echelon research analyst and this is not to be used as a solicitation in a jurisdiction where this Echelon representative is not registered. The information contained has not been approved by and are not those of Echelon, its subsidiaries, affiliates, or divisions including but not limited to Chevron Wealth Preservation Inc. The particulars contained herein were obtained from sources which we believe are reliable, but are not guaranteed by us and may be incomplete.
Assumptions, opinions and estimates constitute the author’s judgment as of the date of this material and are subject to change without notice. Echelon and Richardson do not warrant the completeness or accuracy of this material, and it should not be relied upon as such. Before acting on any recommendation, you should consider whether it is suitable for your particular circumstances and, if necessary, seek professional advice. Past performance is not indicative of future results. These estimates and expectations involve risks and uncertainties and are not guarantees of future performance or results and no assurance can be given that these estimates and expectations will prove to have been correct, and actual outcomes and results may differ materially from what is expressed, implied or projected in such forward-looking statements.
Forward-looking statements are based on current expectations, estimates, forecasts and projections based on beliefs and assumptions made by author. These statements involve risks and uncertainties and are not guarantees of future performance or results and no assurance can be given that these estimates and expectations will prove to have been correct, and actual outcomes and results may differ materially from what is expressed, implied or projected in such forward-looking statements.