Time for real assets?

The Echelon Insights Team • May 03, 2021

Market Recap – Defying all odds


  • The ‘Biden Bust’ that Trump warned us about has turned into the ‘Biden Boom’. April 28th marked President Biden’s 100th day in office. In that time, the S&P 500 is up 8.6%. That mark’s the strongest market performance during a new president's first 100days since JFK in 1961. Higher taxes you say? The markets do not seem to care. Focusing on April, equity markets continue to rise.Inour home currency, the S&P 500 and Nasdaq saw +2.9% and +3.0% growth, respectively. The S&P/TSX is right there alongside them, posting a +2.7% month. Overseas, the Euro Stoxx50 performed on par with North America, ending up +2.0% (CAD). These markets continue to roar as the road to recovery continues. 


  • The positive performance in April has largely been driven by earnings surprises. At the time of writing, 301 companies in theS&P 500 have reported their earnings. 87% of those have reported actual earnings greater than analysts’ estimates. Looking at the past 60 quarters, this is approximately 12.5% greater than the quarterly average. A strong sign that companies are getting back to theirpre-pandemic way of life. 


  • One index our team is currently monitoring is the Bloomberg World Exchange Market Cap index. Put simply, it is the total global market cap of all public equities. Currently sitting at all-time highs of $113 Trillion (chart 1). The impressive velocity and linearity of this rally begs the question; Are we 30% economically better than we were pre-pandemic?


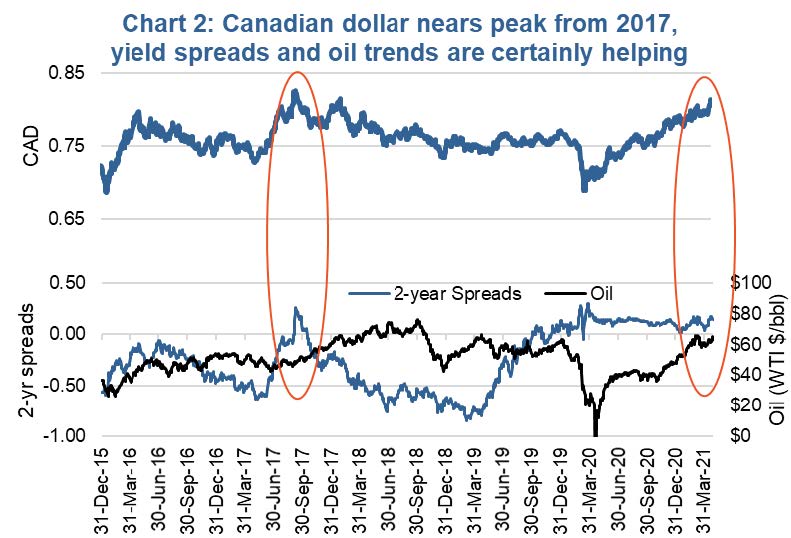
  • The BoCreduced their bond purchases in April causing some strength in the Canadian Dollar. The USD/CAD finished the month of April at ~1.23, which is the strongest the CAD has been since February 2018. The spread between the 2-year Canadian Government Bond (0.30%) and the 2 Year US Treasury yield (0.16%) continues to widen, meaning the shorter-term yield is more attractive in Canadafor the time being. NYM WTI Crude continues its revival this month as well with a +7.5% month, finishing at US$63.58/bbl(chart 2). These two positive moves together have been boons for the Loonie. 


  • Wouldn’t be a market recap these days without a little COVID-19 update. This month, I felt a little self-reflection would be appropriate. If you think our situation is bad here in Canada, Imagine multiplying our population by ~35 and reducing our landmass by two-thirds or 6 million km2. Now insert over 300,000 new cases of COVID-19 every day. That is the current dire situation in India. Seems unfathomable given our situation in Canada remains at 7,000 cases per day. Yes, the cases per population are similar, but imagine if you are packed in so tight that social distancing is not feasible. On top of the cases, low oxygen supply and stadiums filled with cardboard hospital beds are amplifying the situation. The moral of the story is things could be a lot worse. However, Indiais not alone, other countries such as Turkey and Japan are also dealing with another reeling wave. Forgive me, but I, along with many others, have lost track of what number of wave we are currently enduring. 


  • As investors continue their search for diversification or inflation hedges, many are challenged with traditional markets. An alternative to this conundrum is, you guessed it –real assets. Whether it be commodities, real estate, infrastructure or inflation linked securities, our team has prepared a deep dive into the various buckets to help alleviate the burden of navigating these non-traditional solutions. 

Asset Allocation – Market Cycle & Portfolio Positioning

  • Another great month in the books for being an investor. Vaccine rollouts continue to inch us back to the new normal, the economic data continues to surprise even the bullish to the upside, the weather is warming up, company earnings are stellar. Some new highs for a few markets and more impressively most major equity indices are up about 10% since the year started. 


  • With the Market Cycle framework showing 30 bullish signals, we are at a loss trying to remember when the readings were this positive (chart 3).
    Yields, economic data, sentiment, momentum are all positive. The only fly in the soup is valuations that remain high by any measure. There is little concern given the re-opening trends, accommodative monetary policies, spend fiscal policies and pent up demand to ‘live’, the economy will have a helluva year. 


  • With this backdrop we continue to believe the equity markets will be higher in a year’s time even from today’s elevated levels. Market Cycle points to a very low probability of a recession in the coming quarters which means, stay invested. 


  • This of course leads to the question –why are we only at 61% equity, a mere 1% above our baseline equity allocation (chart 4). The answer is simple, while we believe the TSX and, with a bit less conviction, the S&P 500 will be higher in a year, the path likely has a correction in it. Speculative fever has been very elevated so far in 2021 which has contributed to some amazing gains. With some of this speculative behaviour tempering, this could create a feedback loop for the broader markets. Plus, we do believe yields will continue to rise in the coming quarters, the pace and magnitude could easily disrupt asset prices and equity markets, that have become very accustomed to ‘low yields forever’. 


  • Or more likely, there will be a correction triggered by something not even on anyone’s radar. It is surprises, either good or bad, that make markets move. The silver lining is, with such a decent economic backdrop, we would be buyers on any correction. If you are in agreement, we would encourage you to write it down. The reason being when a correction does come, the natural reaction is not to do any buying. This is why most fail to take advantage of temporary periods of market weakness.


  • With elevated cash levels and market weight equity, we believe we are well positioned for a continued bull market with our without a buying opportunity correction. 

Real Assets – Worth considering for the 2020s


  • Real assets check a lot of boxes for reasons to be included in a portfolio such as diversification benefits and cash flow (often with a degree of inflation protection). Add to this many institutions, pensions and ultra wealthy have a real asset component of their portfolios. Unfortunately, lackluster performance over the past decade, which has seen broader markets continually making new record highs, has left many somewhat disappointed.  


  • Before tackling performance and expectations, best to start with ‘what are real assets’, as this often elicits many different responses. Broadly speaking real assets are hard tangible assets, a storer of value, often with an income stream. This can include infrastructure, real estate, natural resources, commodities, or even financial assets with inflation protection. These can include equity or debt, public or private, the combinations and permutations are many. It is such a broad category, many of these subcategories perform very differently given the economy, the markets, yields or inflation. 


  • Chart 5 is nowhere near an exhaustive table for real assets groupings. We have bucketed some of the more prominent categories and outlined typical sensitivities to key market or economic trends. Even these are loose relationships that sometimes hold and sometimes don’t. But this does clearly demonstrate the diversity within real assets. 


  • So with some less than enthusiastic performance over the past few years (chart 6), why should investors take notice today? Well, the past decade has been largely a deflationary environment with lower than trend economic growth and lower inflation. That is ideal for financial assets, much less so for real assets. 


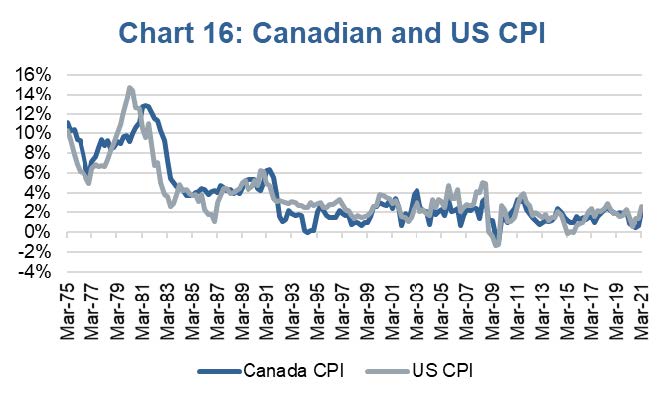
  • Which brings us to the next decade. Inflation is likely going to see a cyclical uptick in the coming quarters or years given input prices, the re-opening from the pandemic and other temporary factors. This will continue to be positive for real assets. More importantly, a number of longer-term the secular trends that kept inflation low for the past decade+ appear to be starting to soften. This includes trends in globalization and demographics. This could easily set the stage for a decade with above trend inflation and yields. 


  • Sorry to all those who jumped early, but it appears time for a real asset allocation is upon us. 


The next few pages we will highlight a few of the key categories within the real asset universe and our views. Plus how we have incorporated real assets in our asset allocation services.

Real Estate – Maybe less real than you think


  • Real estate makes an interesting case for an asset that provides inflation protection. In one sense, it is most certainly a real asset. It is tangible, it is limited in its supply, its value is location dependent. However, the use-cases for real estate run far and wide. Without demand for the land, there is little value in it. Try buying a piece of land in the Yukon –you won’t have any trouble, nor will you need much capital.


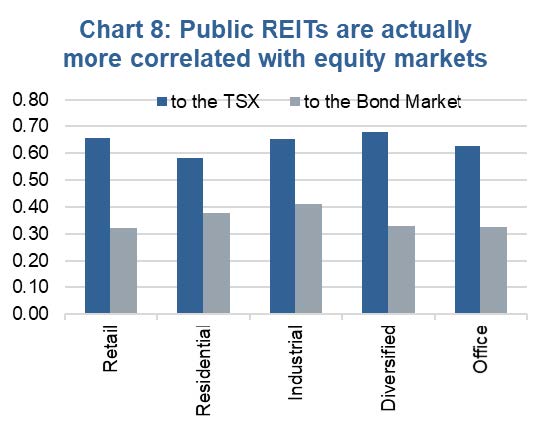
  • The cash flows upon which real-estate is based is often what is traded in the financial markets. Take a residential REIT, for example. Typically using 60-70% of leverage, the REIT itself is far more exposed to the business of renting apartments than it is the land on which the apartment sits… the debt providers get to claim the majority of that. In addition, the building that is being rented depreciates in value –or at least requires cash flow to maintain. Again, the debt providers stay out of that aspect.


  • So while we often look to real estate to fill the Real Assets portion of our portfolios, we really need to understand how much of the exposure we are getting is related to the businesses, and how much attributable to the land value. The 2020 global shutdown taught us that the business models are the more important factor. While some businesses, such as industrial warehousing that fueled the massive shift to online/home delivery shopping, cruised through the pandemic shutdown without so much as a blip in their revenues, others like mall operators have had their revenues slashed… and their equities along with them with little recovery since.


  • Digging a little deeper, we need to understand if the business models operating on the real estate will have the ability to absorb inflation by passing along any inflation costs to their customers. Simply put? Can they raise the rents. If not, the rising price of the land could be offset by the falling (real) value of the cash flows they receive. Depending on the amount of leverage used, this can cut either way.


  • Will employees go back to working every day in their offices? Will they require less density once there? Will flexible/shared workplaces become more prevalent? Will people continue to spend a lot of money on their homes, since they are spending more time there? Will they go back to the cinemas and the malls? These questions are all extremely important in selecting and making real estate investments. Sounds an awful lot like analyzing businesses and financial assets, as opposed to real asset investing.That said, there is an underlying real asset in there somewhere…. 

Infrastructure – A diverse basket 


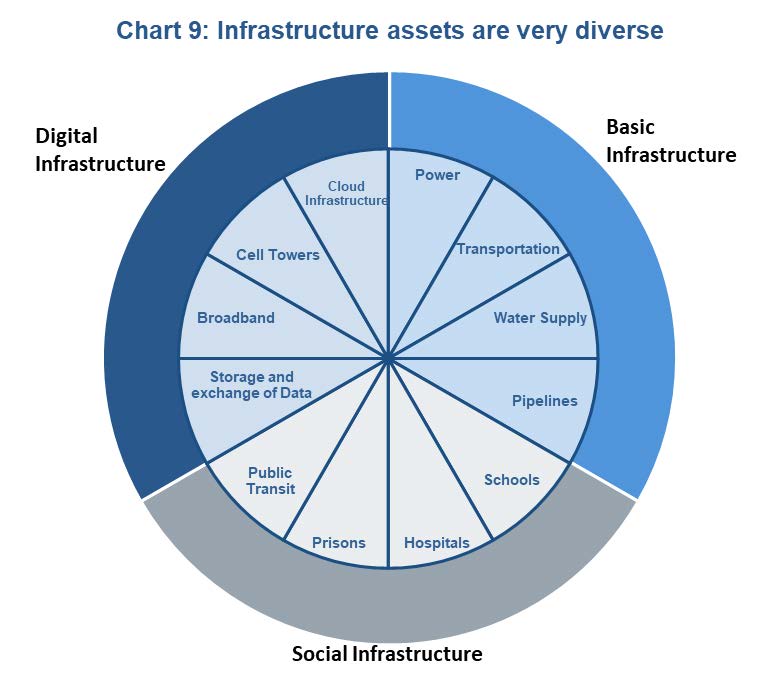
  • Unless your last name is Webster or Oxford, defining infrastructure is not exactly easy. In Chart 9: we did our best to come up with an intuitive classification framework. Basic infrastructure can be thought of as the structures and equipment that bridge distance and bring productive inputs together. This includes anything from a pipeline, electrical grid to a highway or toll bridge. Infrastructure investments are a form of “real assets,” which contain physical assets we see in everyday life and are crucial in a country’s development. Beyond traditional heavy infrastructure there is also social and now digital infrastructure which includes cell towers and data centers. These are both high growth areas, but we also can't’ ignore the clean energy movement which has brought about a tremendous amount of growth, and likely more to come given government mandates around the globe. Infrastructure as asset class is extremely diverse, spanning the spectrum of mature income producing assets to risky growth initiatives full of promise to transform the economy for the future. 


  • Private infrastructure is one of the fastest-growing asset classes, outpacing the broader private capital universe. Based on data from the Burgiss Manager Universe, 40% of the total assets allocated to infrastructure ($442 billion as of 30 September 2020) was raised during the last three years. Pensions and other institutions have been actively increasing their exposure as well. As of the latest Annual Report, the CPP is now up to 8.6% infrastructure. As a result of this interest the infrastructure asset class has grown significantly over the past decade with private investment raising a significant amount of capital. 


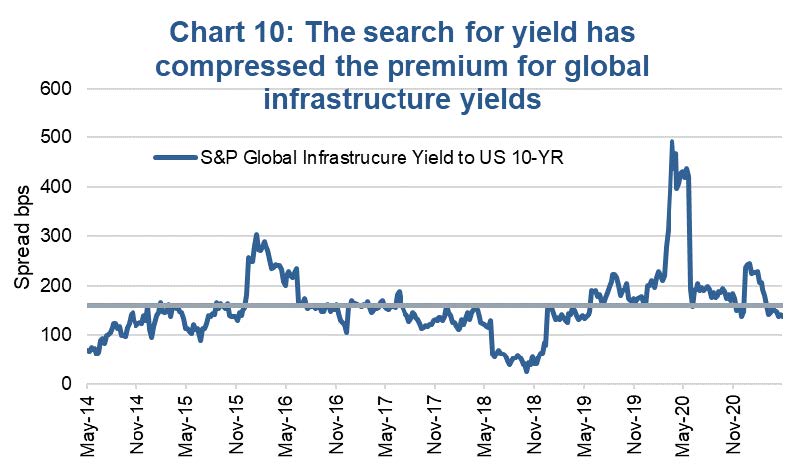
  • The draw for infrastructure investment is simple, it is viewed as non-cyclical, adds portfolio diversification and it offers stable and predictable free cash flows. It is precisely because cash flows are stable that infrastructure projects can take on high levels of leverage, which results in higher interest costs and makes them highly interest rate sensitive. Similar to a long bond, the ‘equity duration’ of infrastructure investments is quite high. Political risk is always a factor as it drives the whole macro effect surrounding new project growth. Currently deficits don’t matter, and infrastructure spending is all the rage so public investment is beginning to pick up. Like all asset's infrastructure investments have done quite well recently. Chart 10: shows that the high yield premium in the space has compressed to below its long-term average. Infrastructure assets are certainly not cheap, but they are not prohibitively expensive like many other sectors of the market. 


  • Infrastructure assets also possess a degree of inflation protection. Most infrastructure assets have an explicit link to inflation through regulation, concession agreements or contracts. Many infrastructure assets operate in monopoly-like competitive positions and enjoy inelastic demand patterns. In most jurisdictions you can’t very well change electric suppliers just because they are raising rates.

Infrastructure – A diverse basket 


  • There are risks in infrastructure investments, and the COVID-19 lockdowns only highlighted some of the risks that were there all along. Diversification is often touted as benefit, but this doesn’t mean the current pandemic hasn’t challenged this characteristic. There are deep-seated ties to the real economy that should not ignored. The stability of infrastructure assets is conditional on the economy itself being stable. In the event of a large shock, even infrastructure assets become more correlated with other asset classes. 


  • The bottom line is that infrastructure is a complex and varied asset class with a variety of options for investors to gain exposure. In an environment characterized by both low-to-negative government bond yields and unprecedented monetary and fiscal stimulus, we expect the cash flows associated with infrastructure income streams to become even more sought-after. Investors have reason to dig deep into the drivers of risk and return now that the space is heading towards the early stages of the next virtuous cycle. 


  • It’s important to know exactly what you are investing in. As you can see in Chart 11 & 12 which highlight the sector and geographic exposures within various infrastructure ETFs, most take significant sector bets as well as a North American focus. Not surprisingly Utilities are high across the board followed closely by Industrial and Energy holdings. Depending on the mandate some can offer a decent amount of Real Estate exposure and others virtually nothing. As always, investment objectives will dictate the most appropriate investment. High growth investors will steer towards early-stage projects or perhaps clean energy ETFs, while those seeking an enhanced income stream will focus funds that tilt towards mature assets that already generate cash flows. 


  • In terms of investment options there are a variety of available pooled funds taking a global, regional or sector specific investment approach. Liquidity is preventive for most investors directly private.

How and when precious metals fit into a real asset portfolio


  • Since August, gold prices have been weakening following a pandemic fueled, fear rally. (Chart 13).


  • At the start of the pandemic, bond yields were falling as growth expectations vanished, giving gold a boost.


  • Then, starting in the summertime, nominal bond yields began outpacing inflation, causing real yields to rise. (Real Yield = Nominal yields –inflation) this put downward pressure on the price of gold, which tends to move inversely to real yields. This was taking place as reflation in the economy was becoming more certain, following vaccine advancements. 


  • However, inflation has remained muted because of slack in the economy and deflationary forces left by the pandemic. 


  • Hopefully now with the worst behind us, it is not only growth but inflation that is becoming more certain. 


  • The unemployment rate in the United States is 6.0%, almost double the pre-pandemic levels but falling.


  • Jerome Powell reiterated this week the FED is seeking “maximum employment”, which would likely allow CPI to go above 3%. The FED also wants to avoid a “taper tantrum”. This bodes well for real rates to move higher in the medium-term. 


  • Although Core PCE inflation has been slow to react, ISM manufacturing prices paid have been quickly moving higher. This leaves agap for core inflation to close by moving higher. (Chart 14).


  • There are many other green-shoots of inflation that don’t show up in Core PCE such as: stocks, base metal prices, lumber…


  • Precious metals typically has two functions, one as a store of value and second is for industrial and retail consumption. Gold and silver are primarily used as a store of value because of their high cost. 


  • There is now a competing store of value asset, Bitcoin, or more broadly speaking cryptocurrency. Widely debated whether this is a real asset or not. It is gaining popularity supporting its place in a diversified portfolio and there is finite supply. 


  • Because of its narrow industrial uses, some economists value gold as 1 / T, where T is trust in the market or system. 


  • With the FED and other central banks around the world printing near endless amounts of currency, more people are losing trust in the monetary system. 


  • Modern Momentary theory which is backed by printing money and paying it off in the future by printing more money is part of the thesis supporting the rally we have seen in both crypto and the prices of precious metals.


  • Precious metal prices were a value-add asset class early in this pandemic-induced market, as bond yields moved to historic lows.Coupled with benign inflation, this provided a solid backdrop for a rally in prices. 


  • As we move into the next phase of the recovery, we believe inflation expectations to grind higher. Together with sustained accommodative monetary policy from central banks, it should provide the backdrop for another upward move for precious metals.

Fixed income – Inflation protected bonds, risk-free real assets


  • The objective of holding “Real Assets”, as opposed to paper assets such as fixed income, equities, and alternative/absolute return instruments is to provide a hedge against unexpected inflation and to generate long term returns. 


  • Government inflation-protected bonds issued by National/Federal Governments that also control their money supply are the only instruments that can provide 100% guaranteed protection against unexpected inflation. The fact they can continue to print money to meet these obligations makes them a perfect inflation hedge.


  • Canadian Government Real Return Bonds (RRBs) and US Treasury Inflation Protected Securities (TIPS) are indexed to inflation as measured by the Consumer Price Index (CPI). As CPI rises, the amount of your coupon payments and your final principal payment rises correspondingly.


  • RRBs and TIPS both trade on a real basis –the price and yield are calculated as with any other bond, but the settlement amount is adjusted based on the underlying index ratio. This index ratio is calculated as the change in CPI since the date of issue. 


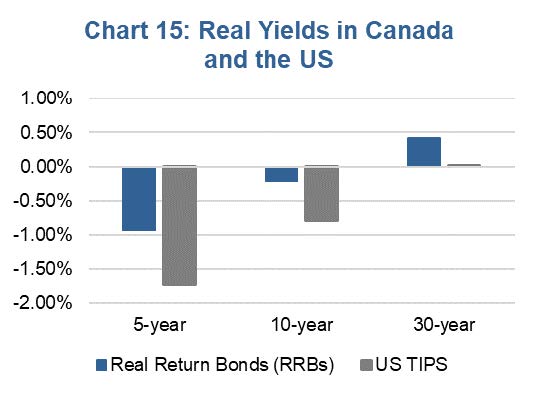
  • Real asset investing should provide a real return above that of inflation. Unfortunately, at this time, given the unprecedented amount of monetary stimulus being provided (including short term interest rates that are fixed well below the current rate of inflation), and due to general investor fears over future inflation, the yields on most inflation protected bonds are below zero. In other words, a 100% inflation hedge now comes at a cost, unless you are willing to take on significant duration risk by buying very long maturities.


  • Inflation protected bonds issued by corporations and sub-sovereign issuers may have real yields in excess of zero, but they introduce an element of credit spread / risk. Although this does support higher longer-term returns, they detract from the inflation hedge and are more highly correlated to nominal bonds and equities. In addition, these instruments are generally rare, as these issuers prefer not to take on the other side of your inflation hedge, of which they have no control. This also makes them fairly illiquid and difficult to source.


  • In the end, the uncorrelated nature of real assets makes them a key diversifier that can improve portfolio efficiency. In addition, inflation risk is real, despite the low inflation we have seen for the past few decades.


  • With RRBs and TIPS the only perfect inflation hedge, we do believe they deserve a permanent allocation along with other real assets as a part of a broadly diversified portfolio, but at the moment you are certainly paying for it.

Charts are sourced to Bloomberg L.P. unless otherwise noted.


The contents of this publication were researched, written and produced by Richardson Wealth Limited and are used herein under a non-exclusive license by Echelon Wealth Partners Inc. (“Echelon”) for information purposes only. The statements and statistics contained herein are based on material believed to be reliable but there is no guarantee they are accurate or complete. Particular investments or trading strategies should be evaluated relative to each individual's objectives in consultation with their Echelon representative. 


Forward Looking Statements


Forward-looking statements are based on current expectations, estimates, forecasts and projections based on beliefs and assumptions made by author. These statements involve risks and uncertainties and are not guarantees of future performance or results and no assurance can be given that these estimates and expectations will prove to have been correct, and actual outcomes and results may differ materially from what is expressed, implied or projected in such forward-looking statements.


The opinions expressed in this report are the opinions of the author and readers should not assume they reflect the opinions or recommendations of Echelon Wealth Partners Inc. or its affiliates. Assumptions, opinions and estimates constitute the author’s judgment as of the date of this material and are subject to change without notice. We do not warrant the completeness or accuracy of this material, and it should not be relied upon as such. Before acting on any recommendation, you should consider whether it is suitable for your particular circumstances and, if necessary, seek professional advice. Past performance is not indicative of future results. These estimates and expectations involve risks and uncertainties and are not guarantees of future performance or results and no assurance can be given that these estimates and expectations will prove to have been correct, and actual outcomes and results may differ materially from what is expressed, implied or projected in such forward-looking statements.

The particulars contained herein were obtained from sources which we believe are reliable, but are not guaranteed by us and may be incomplete. The information contained has not been approved by and are not those of Echelon Wealth Partners Inc. (“Echelon”), its subsidiaries, affiliates, or divisions including but not limited to Chevron Wealth Preservation Inc. This is not an official publication or research report of Echelon, the author is not an Echelon research analyst and this is not to be used as a solicitation in a jurisdiction where this Echelon representative is not registered.


The opinions expressed in this report are the opinions of its author, Richardson Wealth Limited (“Richardson”), used under a non-exclusive license and readers should not assume they reflect the opinions or recommendations of Echelon Wealth Partners Inc. (“Echelon”) or its affiliates.


This is not an official publication or research report of Echelon, the author is not an Echelon research analyst and this is not to be used as a solicitation in a jurisdiction where this Echelon representative is not registered. The information contained has not been approved by and are not those of Echelon, its subsidiaries, affiliates, or divisions including but not limited to Chevron Wealth Preservation Inc. The particulars contained herein were obtained from sources which we believe are reliable, but are not guaranteed by us and may be incomplete.


Assumptions, opinions and estimates constitute the author’s judgment as of the date of this material and are subject to change without notice. Echelon and Richardson do not warrant the completeness or accuracy of this material, and it should not be relied upon as such. Before acting on any recommendation, you should consider whether it is suitable for your particular circumstances and, if necessary, seek professional advice. Past performance is not indicative of future results. These estimates and expectations involve risks and uncertainties and are not guarantees of future performance or results and no assurance can be given that these estimates and expectations will prove to have been correct, and actual outcomes and results may differ materially from what is expressed, implied or projected in such forward-looking statements.


Forward-looking statements are based on current expectations, estimates, forecasts and projections based on beliefs and assumptions made by author. These statements involve risks and uncertainties and are not guarantees of future performance or results and no assurance can be given that these estimates and expectations will prove to have been correct, and actual outcomes and results may differ materially from what is expressed, implied or projected in such forward-looking statements. 

Echelon’s Insight Team


Echelon’s Insight Team includes members in various departments such as Wealth Management, Capital Markets, Marketing, Talent, and Compliance who have subject matter expertise and collaborate together to build quality content to help our clients. This team approach helps us ensure content is produced that is meaningful, accurate and timely.

06 May, 2024
Take your pick. There is no shortage of both good and bad news floating about the financial markets. To be fair, this is always the case. The hard part is understanding which side is stronger today and which side will be stronger tomorrow. With markets up low to mid-single digits following a very strong Q4 finish to 2023, most would agree the optimists are carrying the day at the moment. It is not just rose-coloured glasses; there is good news out there. Economic growth signs or momentum appear to be improving year-to-date. Dial back a few quarters, and the U.S. economy remained resilient while other economies softened or were rather lacklustre, including Canada, Europe, Japan, and China, to highlight some of the biggies. Today, while Canada is struggling, momentum in the U.S. has moved even higher, and there are signs of improvement in most jurisdictions.
29 Apr, 2024
There are three things you should rarely ever bet against: the Leaf’s opposing team in the playoffs, the American consumer’s ability to spend, and corporate profits. As we are now about halfway through U.S. earnings season, once again, positive surprises remain the norm; 81% have beaten. It's a bit better than the 20-year average of 75%. The fact is that companies are good at managing analysts’ expectations. At least enough to beat them when the numbers hit the tape. The size of the positive surprises have been encouraging as well, at just under 10%. The highest surprise magnitude in some time.  One of our reservations on the sustainability of this market rally over the past couple of quarters has been the flat earnings revisions. In other words, global markets are up over 20% but earnings estimates have remained flat or tilted down slightly. More often than not, markets trend in the same direction as earnings revisions. Earnings get revised up when companies raise guidance and/or analysts become more encouraged about growth prospects. That is a good thing for markets. Obviously, downward revisions are bad. Yet estimates have remained very flat as markets marched higher, a challenging combination.
22 Apr, 2024
The oil market has been interesting lately and, to the surprise of many, has been the biggest silent outperformer this year. There is no shortage of geopolitical events to choose from that’s leading to a higher risk premium in oil with Brent breaking $90, whether it’s the Houthis missile attacks in the Red Sea leading to a massive re-route of trade, Ukraine’s drone strikes on Russian refineries, and the latest escalation between Israel and Iran leading to some news outlets using WWIII as click bait-y headlines. Given the run-up in oil prices, Canadian oil equities have clearly benefitted from the much higher torque. But there is a layer of even better news: The Transmountain Expansion (TMX) continues to look to be in operation by May, which would lead to much better pricing on the Western Canadian Select (WCS). With the current setup for the oil markets, some key questions that we often get from investors are: How sustainable is the rally in Canadian energy names? To determine if the oil equities are overstretched, we can look at the debt-adjusted cash flow (DACF) multiples of the major integrated oil names and see how the valuation has shifted in light of the recent oil move. From Exhibit 1, the DACF multiples for the Canadian integrated have been fairly range-bound over the last year, also in line with WTI, which has been in the $70 - $85 range. As a starting point, we can infer that the valuations of the companies have been commensurate with the movements in the underlying oil price deck and in line with where the equities should trade in the cycle historically over the last couple of years. Typically, in the commodities cycle, higher prices are usually coupled with lower multiples as market participants will usually price in lower normalized prices and vice versa, so a cause of concern would be if valuation starts trending towards the 6.5x – 7.0x+ area if oil prices continue to stay in the upper bounds of the $70 - $90 range or higher.
MORE POSTS →
Share by: