It is difficult to characterize 2020 other than to use the oft-repeated term ‘unprecedented’. The past year does not fit into any historical ‘box’. The pandemic has taken a terrible toll on humanity, while the sheer scope of cases and deaths leaves many of us numb: at last count, 84 million confirmed cases and 1.8 million deaths. Social distancing has proven the most effective to slow the spread, which has taken a terrible toll on many parts of the global economy. This led to the biggest drop in economic output in the second quarter. Yet other parts of the economy are relatively unscathed or have even benefited. The economy has been recovering and adjusting, with a lot of help from monetary and fiscal stimulus. But many millions are still out of work and many industries are struggling to get through to the other side.
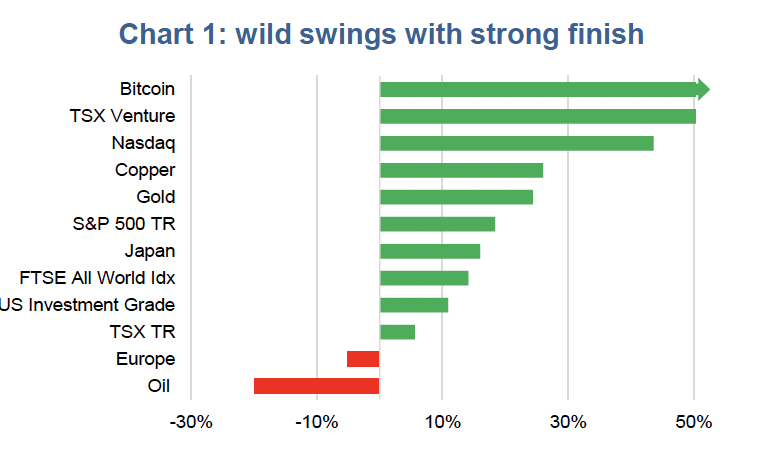
Astonishingly, capital markets and many other markets enjoyed outsized returns but not until going through the quickest bear market in history. Six percent of the U.S. population has contracted COVID-19 at one point or another, total employment is 10 million below the February peak, and the S&P 500 finished 2020 up +18.4%. Initial Public Offerings (IPOs) enjoyed one of the best years ever. We saw speculative bubble behaviour among the clean-tech sector, stocks benefitting from the work-from-home wave and bitcoin. Oh, and bonds did really well too. International markets were less robust, but still impressive given the environment.
Our scoring or ranking system uses a combination of an industry’s correlation to bond yields, sensitivity to bond yields (think like Beta but instead of relative to the market it’s relative to yields) and an out-of-sample score for periods over the past decade of rising yields. Chart 2 depicts the scoring of a number of key sectors/industries within the TSX. The top grouping, Cyclical Yield, are those that we would expect to hold up better in a rising yield environment. The bottom grouping, Interest Rate Sensitive, are those that we would expect to perform best in a falling yield environment.
Chart 3 compares the performance of the Cyclical Yield versus Interest Rate Sensitive industries over the past decade. Cyclical Yield is outperforming when the black relative line is rising and underperforming when falling. The grey shaded areas are periods of rising bond yields.
The market & the economy – One recurring question in 2020 was the divergence between the economy and the equity markets (Chart 3). It is good to think of the equity markets as a giant crowd-sourced forecasting mechanism, attempting to ascertain the future. While often wrong, it does look farther forward compared with economic data that is often a snapshot of the present. Markets continue to look past the pandemic and associated recession. It could very well be too optimistic; only time will tell.
Hooked on liquidity – The markets, real estate and other assets are firmly addicted to liquidity. The monetary response in 2020 has pushed the envelope of what central bankers can and are willing to do. There’s no denying it worked, but has likely strengthened the addiction. And if there was any doubt before there is less now – don’t fight the Fed!
Emotions are an investor’s worst enemy – Given most markets and asset classes did relatively well once 2020 crossed the finish line, the only folks who really lost out were those that capitulated during the February/Market sell off. The lesson is to not let your emotions drive asset allocation decisions.
Charts are sourced to Bloomberg L.P. unless otherwise noted.
The contents of this publication were researched, written and produced by Richardson Wealth Limited and are used herein under a non-exclusive license by Echelon Wealth Partners Inc. (“Echelon”) for information purposes only. The statements and statistics contained herein are based on material believed to be reliable but there is no guarantee they are accurate or complete. Particular investments or trading strategies should be evaluated relative to each individual's objectives in consultation with their Echelon representative.
Forward Looking Statements
Forward-looking statements are based on current expectations, estimates, forecasts and projections based on beliefs and assumptions made by author. These statements involve risks and uncertainties and are not guarantees of future performance or results and no assurance can be given that these estimates and expectations will prove to have been correct, and actual outcomes and results may differ materially from what is expressed, implied or projected in such forward-looking statements.
The opinions expressed in this report are the opinions of the author and readers should not assume they reflect the opinions or recommendations of Echelon Wealth Partners Inc. or its affiliates. Assumptions, opinions and estimates constitute the author’s judgment as of the date of this material and are subject to change without notice. We do not warrant the completeness or accuracy of this material, and it should not be relied upon as such. Before acting on any recommendation, you should consider whether it is suitable for your particular circumstances and, if necessary, seek professional advice. Past performance is not indicative of future results. These estimates and expectations involve risks and uncertainties and are not guarantees of future performance or results and no assurance can be given that these estimates and expectations will prove to have been correct, and actual outcomes and results may differ materially from what is expressed, implied or projected in such forward-looking statements.
The particulars contained herein were obtained from sources which we believe are reliable, but are not guaranteed by us and may be incomplete. The information contained has not been approved by and are not those of Echelon Wealth Partners Inc. (“Echelon”), its subsidiaries, affiliates, or divisions including but not limited to Chevron Wealth Preservation Inc. This is not an official publication or research report of Echelon, the author is not an Echelon research analyst and this is not to be used as a solicitation in a jurisdiction where this Echelon representative is not registered.
The opinions expressed in this report are the opinions of its author, Richardson Wealth Limited (“Richardson”), used under a non-exclusive license and readers should not assume they reflect the opinions or recommendations of Echelon Wealth Partners Inc. (“Echelon”) or its affiliates.
This is not an official publication or research report of Echelon, the author is not an Echelon research analyst and this is not to be used as a solicitation in a jurisdiction where this Echelon representative is not registered. The information contained has not been approved by and are not those of Echelon, its subsidiaries, affiliates, or divisions including but not limited to Chevron Wealth Preservation Inc. The particulars contained herein were obtained from sources which we believe are reliable, but are not guaranteed by us and may be incomplete.
Assumptions, opinions and estimates constitute the author’s judgment as of the date of this material and are subject to change without notice. Echelon and Richardson do not warrant the completeness or accuracy of this material, and it should not be relied upon as such. Before acting on any recommendation, you should consider whether it is suitable for your particular circumstances and, if necessary, seek professional advice. Past performance is not indicative of future results. These estimates and expectations involve risks and uncertainties and are not guarantees of future performance or results and no assurance can be given that these estimates and expectations will prove to have been correct, and actual outcomes and results may differ materially from what is expressed, implied or projected in such forward-looking statements.
Forward-looking statements are based on current expectations, estimates, forecasts and projections based on beliefs and assumptions made by author. These statements involve risks and uncertainties and are not guarantees of future performance or results and no assurance can be given that these estimates and expectations will prove to have been correct, and actual outcomes and results may differ materially from what is expressed, implied or projected in such forward-looking statements.