Grab that bottle of Veuve and give your sabrage skills a test;
inflation is over, and it's time to party.
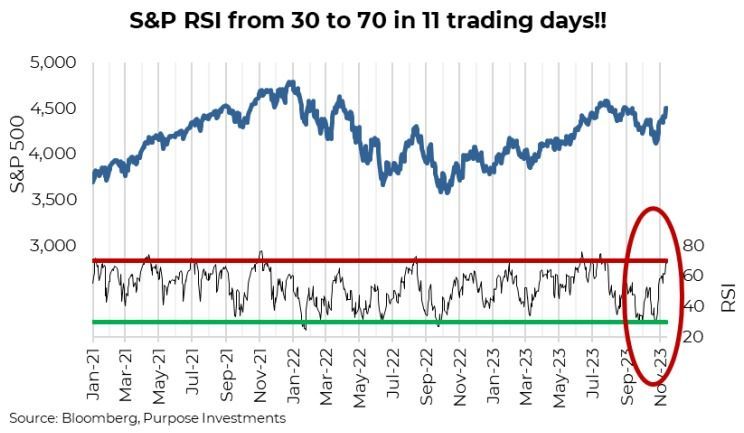
Well, that is the way the equity markets have rejoiced on a handful of data points supporting the view that inflation risk is quickly fading. Rejoice may be a bit of an understatement; the S&P 500 went from woefully oversold at the end of October to being overbought a mere 2 1/2 weeks later (as measured by S&P 500 relative strength, aka RSI). The old adage is markets take the stairs when going higher and the elevator when lower, denoting the amount of time passing (stairs being slower than an elevator). Well, over the past few months, it has been the opposite after a three-month steady grind lower and a sudden jump higher.
This swing in the RSI measure isn’t unprecedented, but looking back at the past 25 years, it certainly doesn’t happen often. Most past occurrences followed more tumultuous declines, such as the Asian crisis or a few during the multi-year tech bust. But let’s not diminish the good news – Inflation and the response to inflation by central banks (rates/yields) have been the greatest angst for markets during the past couple of years. Cooling inflation fears is a HUGE positive for markets.
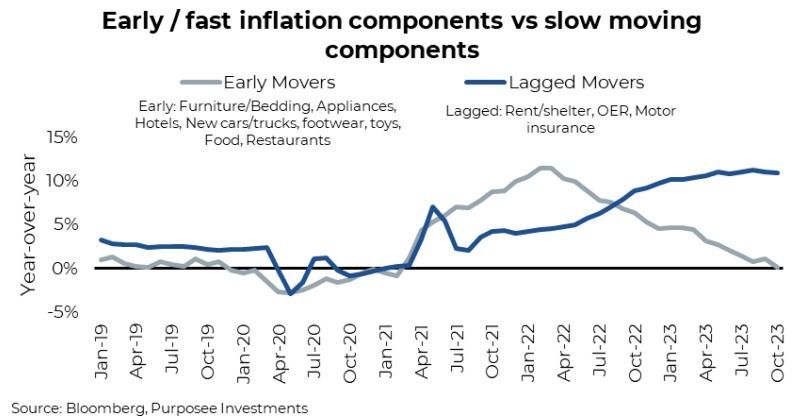
Among all the components of the CPI index, some react to changes more quickly than others. The faster moving parts are coming down quickly and are now flat on the year (chart). The slower components are still high but also appear to be starting to roll over.
We are not saying inflation is over, nor that it will follow a nice orderly decline back to that sweet spot of 2%. In fact, we believe it will become more volatile in the years ahead. And while it may get down that low (or even lower), the swings will be higher than in recent history. A lot of long-term factors will keep it higher than in the past decade. Yet, with the news at the moment, we appear to be clearly on one of those downward trends, so let's party.
Cooler inflation data and cooler economic data have helped bond yields come down. Measuring the 10-year Treasury, yields dropped from 5.0% at the S&P 500 low near the end of October to 4.46% at the time of writing. So does a 50bps yield drop equate to a 9% or near 400-point rise in the S&P 500? The lower yield does open the door to some multiple expansion. The market weakness in October was primarily caused by high yields. If 50bps = 9%, well load up. We think yields will continue to grind lower on softer economic data. Unfortunately, that “math” won’t hold. There has been something else afoot in the month of November… stimulus.
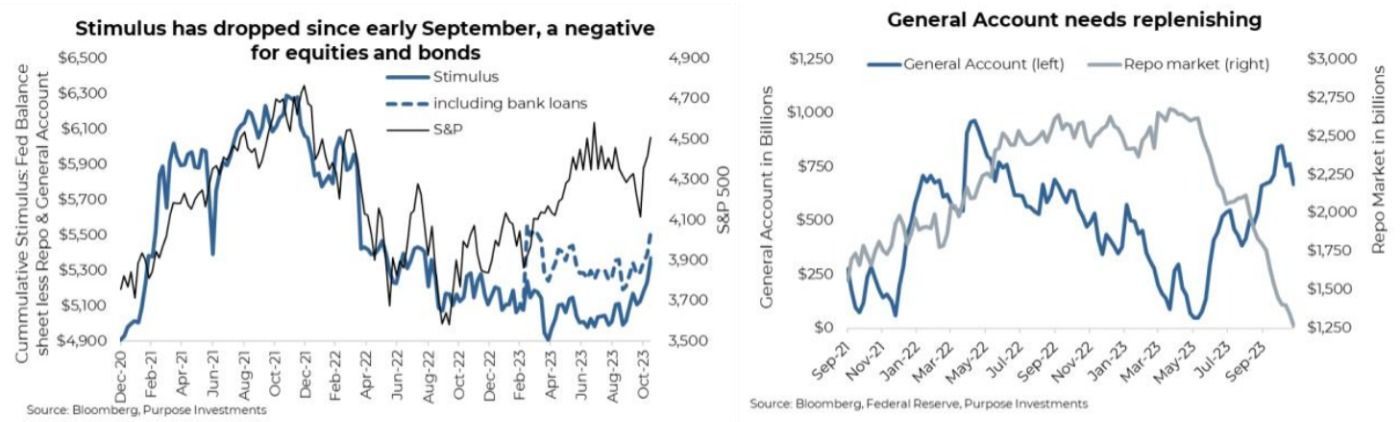
In a simpler world, higher overnight Fed funds rates plus gradual selling of bonds at about $50 billion per month from the central bank’s $7 trillion hoard would equate to tightening financial conditions. Or Quantitative Tightening (QT), the opposite of Quantitative Easing (QE). But just like inflation, Q (E or T) doesn’t move in a straight line. The Fed’s balance sheet has continued to grind lower, but the general account and Repo market (Reserve Repurchase Agreements) have not. In June, with the debt ceiling kicked down the road a bit, government bond issuance jumped higher to replenish the general account (the government's chequing account). This would add to tightening, sucking money out of the financial system. But, the Repo market simultaneously started to move lower. Think of the Repo market as a place where money ended up when there was too much money sloshing about, and it has ballooned since 2021.
Declining Repo balances is money making its way into the financial system (QE). From mid-June till the end of October, this was largely offset by a rising General Account (roughly net neutral). But since the General Account was replenished back to the more historical balance of $700-800 billion and given the Repo market keeps declining, this equated to QE since mid-October and into November.
Final Thoughts
We are not saying the cooling inflation plus softer economic data bringing down bond yields isn’t the main good news story of this recent rally. It likely is, and it is really good news. But stimulus has increased the magnitude of the gains. So what happens next? The Repo market, which before 2021 was near a zero balance, could continue to drain. At $1.26 trillion, it still has a ways to go. If the General Account remains stable, any faster draining of the Repo above $50B per month to offset the Fed’s balance sheet reduction would be stimulative. So this could have further legs, perhaps even leading to that Santa Claus rally many like to talk about.
Alternatively, if the draining of the Repo slows or if bond yields stop heading lower, this market rally may run out of steam, becoming more of a Turkey rally (American Thanksgiving Turkey, that is). Wouldn’t stand in the way of it, but this is a renter’s rally. Especially given earnings revisions have turned flat to slightly negative and economic data is softening, making the underlying foundation not so solid.
— Craig Basinger is Chief Market Strategist at Purpose Investments
Source: Charts are sourced to Bloomberg L.P. and Purpose Investments Inc.
The contents of this publication were researched, written and produced by Purpose Investments Inc. and are used by Echelon Wealth Partners Inc. for information purposes only.
This report is is authored by Craig Basinger, Chief Market Strategist, Purpose Investments Inc.
Disclaimers
Echelon Wealth Partners Inc.
The opinions expressed in this report are the opinions of the author and readers should not assume they reflect the opinions or recommendations of Echelon Wealth Partners Inc. or its affiliates. Assumptions, opinions and estimates constitute the author's judgment as of the date of this material and are subject to change without notice. We do not warrant the completeness or accuracy of this material, and it should not be relied upon as such. Before acting on any recommendation, you should consider whether it is suitable for your particular circumstances and, if necessary, seek professional advice. Past performance is not indicative of future results. The comments contained herein are general in nature and are not intended to be, nor should be construed to be, legal or tax advice to any particular individual. Accordingly, individuals should consult their own legal or tax advisors for advice with respect to the tax consequences to them.
Purpose Investments Inc.
Purpose Investments Inc. is a registered securities entity. Commissions, trailing commissions, management fees and expenses all may be associated with investment funds. Please read the prospectus before investing. If the securities are purchased or sold on a stock exchange, you may pay more or receive less than the current net asset value. Investment funds are not guaranteed, their values change frequently and past performance may not be repeated.
Forward Looking Statements
Forward-looking statements are based on current expectations, estimates, forecasts and projections based on beliefs and assumptions made by author. These statements involve risks and uncertainties and are not guarantees of future performance or results and no assurance can be given that these estimates and expectations will prove to have been correct, and actual outcomes and results may differ materially from what is expressed, implied or projected in such forward-looking statements. Assumptions, opinions and estimates constitute the author’s judgment as of the date of this material and are subject to change without notice. Neither Purpose Investments nor Echelon Partners warrant the completeness or accuracy of this material, and it should not be relied upon as such. Before acting on any recommendation, you should consider whether it is suitable for your particular circumstances and, if necessary, seek professional advice. Past performance is not indicative of future results. These estimates and expectations involve risks and uncertainties and are not guarantees of future performance or results and no assurance can be given that these estimates and expectations will prove to have been correct, and actual outcomes and results may differ materially from what is expressed, implied or projected in such forward-looking statements. Unless required by applicable law, it is not undertaken, and specifically disclaimed, that there is any intention or obligation to update or revise the forward-looking statements, whether as a result of new information, future events or otherwise. Before acting on any recommendation, you should consider whether it is suitable for your particular circumstances and, if necessary, seek professional
advice.
The particulars contained herein were obtained from sources which we believe are reliable, but are not guaranteed by us and may be incomplete. This is not an official publication or research report of either Echelon Partners or Purpose Investments, and this is not to be used as a solicitation in any jurisdiction.
This document is not for public distribution, is for informational purposes only, and is not being delivered to you in the context of an offering of any securities, nor is it a recommendation or solicitation to buy, hold or sell any security.