Yes, the summer rally really went from oversold levels in mid June to getting a tailwind from a number of contributors. Valuations in June had become much more appealing, and second quarter earnings did not erode as many had expected from rising costs. Meanwhile recession fears were tapped lower thanks to improving economic data and inflation pressures started to roll over a bit.
Seems that the left side of the porridge (inflation) was too hot and the right side (the economy) too cool, but mixing them together made things just right for a rally.
Markets bounced pretty hard off the June bottom, during summer trading that typically has less liquidity.
Unfortunately, around mid August the market appeared to be limping across the line. Seems the porridge isn’t cooling fast enough for the Fed, which reiterated an aggressive hiking path as inflation is enemy #1. Meanwhile, the improving economic data appears to be fleeting, especially when you look globally. And now we are heading into a time of year that is historically challenging for markets.
As we move into the third period of 2022, the outlook remains challenging. Inflation may be starting to come down, but the pace remains a big question as service-related inflation is building while goods prices are becoming disinflationary. The one certainty is that short-term interest rates will continue to move higher this year. This is already being felt materially in housing markets given the high sensitivity to financing costs. Meanwhile manufacturing, which has been playing catch-up due to previous shortages, is beginning to weaken. On the positive side,
the U.S. consumer remains healthy, but this remains one of the few bright spots globally.
The final third of 2022 is likely to continue to see heightened volatility. Seasonality, midterm elections, inflation, slowing economic growth, negative earnings revisions, and tightening policy are all headwinds. The winds may strengthen or dissipate at times, which will likely see bigger than normal swings in the market in both directions. As we pointed out in our second half outlook, we believe the market should finish higher than end of June levels, but by no means will it be a smooth line.
Was June the bottom…we don’t think so
In mid June, both global equities and the S&P 500 reached a trough level that was down about 23% compared with the highs about six months ago.
The TSX, benefitting from commodity supply disruptions and comprising more value stocks, peaked at the end of March and bottomed in July—a month after the broader market. This is notable as the TSX is more sensitive to global recession fears and less sensitive to inflation fears. This is why the TSX was one of the best markets earlier in the year, before fears started migrating from inflation to recession.
June, or July for the TSX, could have been the bottom. Bear market bottoms are always doubted after the rally begins, often for months. And there is no textbook or normal recovery path. Some bears end with a violent upswing or a V-shaped bottom; others are much more gradual and grind out for months with only limited gains. Sometimes earning bottom before the market bottoms, sometimes after, and sometimes earnings don’t contract at all.
So far this market decline has been one of a valuation reset. Breaking down the return of the S&P and TSX, dividends and positive earnings growth have been evident, which means the market drop has been all about falling valuations or the market multiple (red bars in the chart). With the S&P now trading at 17x and the TSX way down at 12x, these are much more reasonable or even attractive valuations. And one thing is certain, lower valuations often translate into better future price returns. But the concern now is earnings, which are a function of economic growth.
A one-legged stool, albeit a strong leg
Let’s simplify the global economy into three pieces – North America, Europe, and Asia.
Asia has some positives, including that many countries are increasingly opening up from Covid-related restrictions. Restrictions were stricter for longer compared with the West given vaccine penetration and population density. Opening provides a good economic boost. However, China remains the biggest driver of economic growth and their lockdowns have been more persistent. Plus, the real estate industry is still troubled.
Put that all together, Asia is likely more of a headwind for the global economy than a tailwind.
Europe, well do we really have to say anything? With inflation, potential energy rationing, consumer budgets increasingly consumed by electricity costs, and a war in the region...could all this be priced into the euro and the markets? It’s very hard to say. Nonetheless,
Europe is likely a detractor from global growth.
North America is largely about the U.S. and the U.S. consumer, which comprises about 20% of the global economy. This is the good news. With employment and wage gains and not being overly levered, the U.S. consumer is likely to remain a positive contributor even with higher interest rates and elevated food and energy costs. But
it’s hard to envision spending accelerating, and when it comes to economics, rate of change is often the more important factor.
So, there we have it: the global economy is sitting on a one-legged stool.
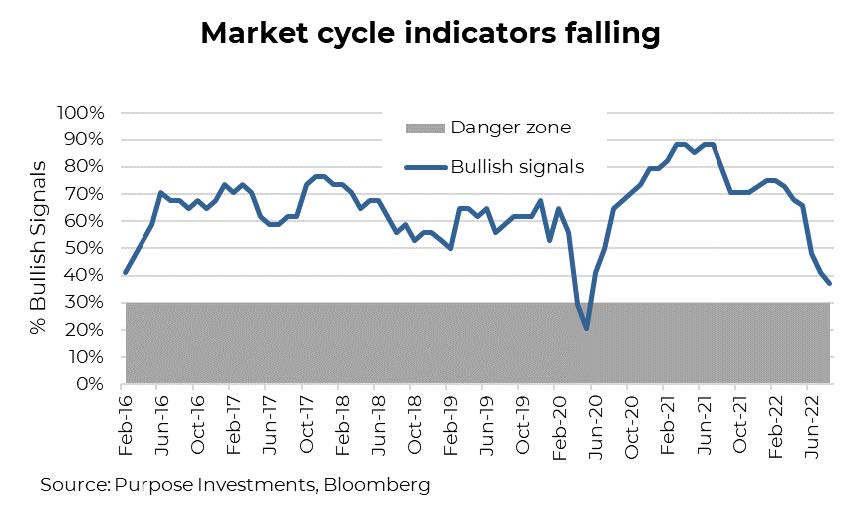
A recession isn’t a certainty in the coming quarters, but the risk continues to rise. This has been picked up in our Market Cycle framework, which continues to inch closer to the historical danger zone.
Rising interest rates have been one negative for much this year. And on the global economy, most signals are bearish, which isn’t too surprising since the stool is missing those two legs.
U.S. economic data has held up better but has started to soften—notably in the housing data, which is more sensitive to interest rates.
But even manufacturing data is weakening after remaining resilient as companies wrestled to catch up. More recently, fundamentals have started to erode, mainly in future earnings revisions.
Portfolio Construction
Yes, headwinds for the markets remain. The global economy is slowing, which is starting to be reflected in earnings expectations. On a positive note, inflation appears to be rolling over, which is good news. But as we head into the seasonally difficult September and October months alongside the U.S. midterms elections, markets will continue to be challenging.
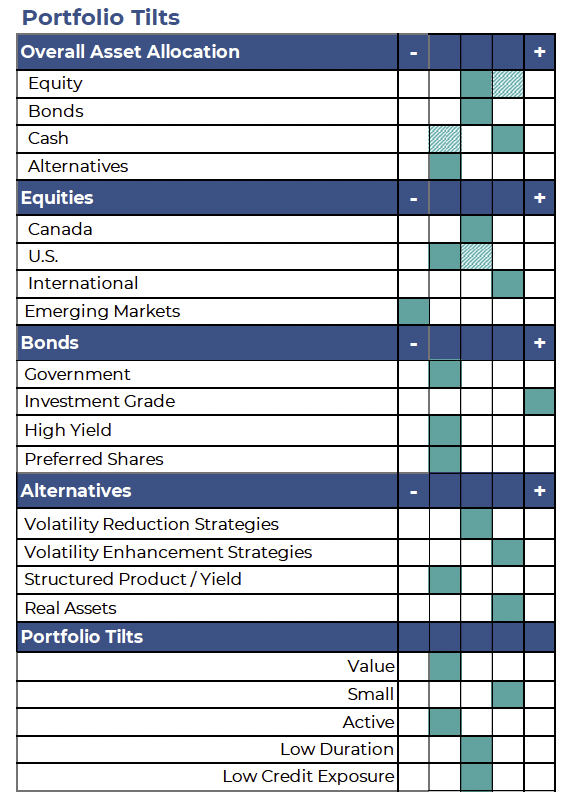
During August, we reduced market exposure primarily through reducing U.S. equity weights and raised cash, outlined in our portfolio tilts.
Below we outline our likely paths for equities and bonds in the coming months. We stress “likely” as our path for portfolio construction is not just predicated on our expectations for the economy but also how the markets react.
Equities – caution with our finger on the trigger
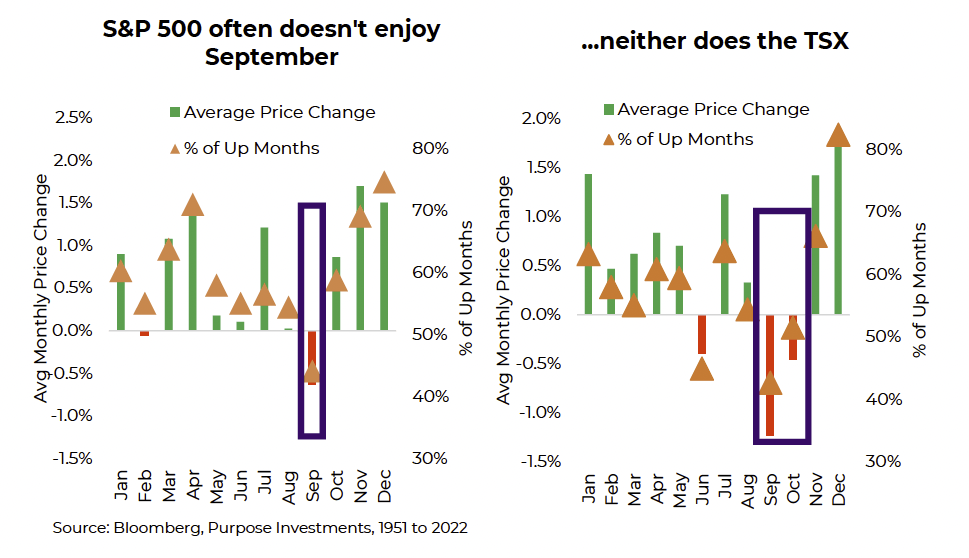
For many, flipping the calendar over to September is about when the kids will be heading back to school; but, for investors, it’s usually also a good a reminder to look at your portfolio and make sure you are set up for some volatility. Looking at seasonality for the last 50+ years, the period of September through October is one of the worse for equity markets (refer to the chart).
Many of the most dramatic events in stock market history have occurred in this time (think 2008 and 1987), and while we aren’t forecasting anything of that magnitude this year, it is never a bad idea to make sure you are prepared. So far 2022 has been a year many investors would rather forget as both bonds and stocks have lost money at the same time, which is not often the case. The main reason for this, of course, has been the dramatic moves from global central banks that are removing pandemic stimulus programs to control inflation.
The battle against inflation was never going to be easy but add on that the effect on commodities as a result of the Russian invasion of the Ukraine and continued tension with China, the factors weighing on markets during the first half of the year persist. Investors in July were able to breath a sigh of relief upon seeing the Q2 earnings reports as companies did an admiral job of controlling expenses to maintain earnings growth, but as many companies get ready to meet investors again for “conference season” the updates we get in the next few weeks may be less optimistic.
Another event that will be front and centre for American markets will be the U.S. mid-term elections in November. U.S. politics have become very polarizing and as polls swing, this may add to volatility.
It’s not a huge sample size but September and October markets during midterm elections usually have an even worse track record.
For us, all of this adds up that it’s not the time to be a hero and take undue risk in your portfolio. For those who have weathered the storm so far this year, consider becoming a little more defensive until some of these events pass or markets become more comfortable with the direction. That will give you optionality to reassess in a few months heading into year end, which is normally a much stronger time for equity markets.
To become more defensive, we suggest a few alternatives. First, cash is nice. We increase cash in August and the good thing is that post rate hikes, cash has become an investible asset class once again. Second, look at options strategies. Volatility elevated funds that generate yield through call or put writing can generate income and potentially provide downside protection as well. On the fixed income side, while yields may still climb, recession risks are mounting. Adding duration is not as scary now as it was in years past.
As always, we would point to being tactical and seeking active investment strategies. As we head through earnings season, not every company will handle these changes as well as others, and similarly not every asset class will do as well as others.
We are entering one of the most difficult periods of the year for markets, which appears to be coming early based on the soft finish to August. Should we see another pullback in markets to new lows because of the many headwinds (inflation, recession, earnings, seasonality)? With dry powder, we intend to be opportunistic.
Bonds – moving in tranches
At the start of 2022, we were underweight in bonds with portfolio positioning tilted to much lower duration and more credit. As yields rose, we moved in steps, adding duration and dialing back on the credit overweight to our current neutral stance: neutral from an overall allocation to bonds and neutral from a duration/credit exposure.
Our strategy, which remains, was to increase duration and bond weights as yields rose.
Currently, our overall portfolio-recommended duration is in the range of 4.5-5, up from 2.5-3 at the start of the year. While we currently cannot envision ever getting to market weight duration, which sits at about 7, if 10-year yields were to climb up to around 4%, we would take that opportunity to add more duration, perhaps up to the 6 range. Likely trimming credit as well.
Duration has been the bane of bond allocations this year as yields have moved higher. But remember, if a recession comes to fruition in 2023, duration will once again likely be a portfolio stabilizer. And with each tick higher in yields, the future expected return rises as well. But we simply don’t know how high yields will go, which is why moving in steps is our preferred strategy.
Why Model Portfolios?
In the financial industry, there has been an increasing trend from advisors and investors to deploy model portfolios. One could even argue that the “trend” is over and implementing a model portfolio is now considered to be industry standard. The typical Canadian advisor has over a hundred clients. Many teams across the country manage 500+ clients, which virtually seems impossible without implementing some form of a model portfolio. Monitoring hundreds of client accounts with different investments is time-consuming, clearly not scalable, and the efficacy of the portfolio management process does suffer. Model portfolios, while a bit less customizable, solve many of these problems.
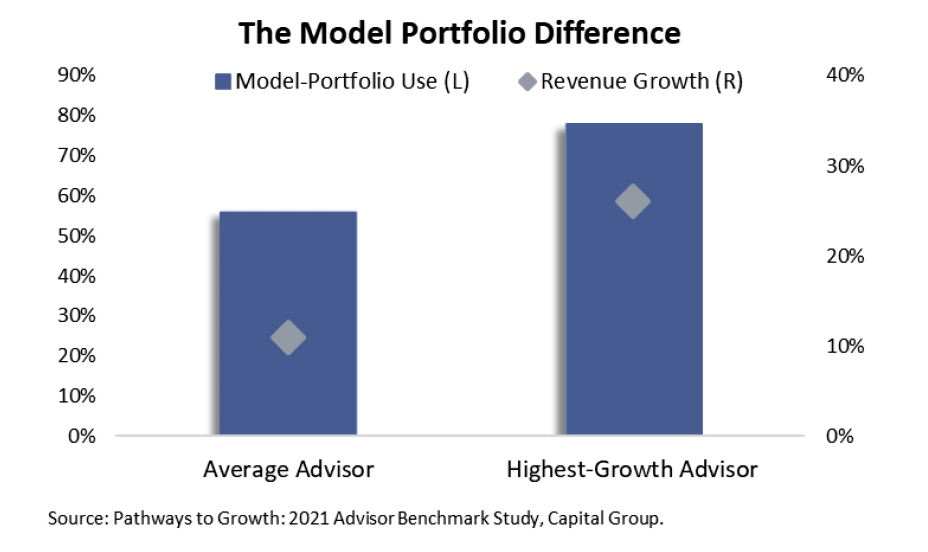
A 2021 study by Capital Group found there was a significant difference between average advisors and the highest-growth advisors. There were solid market returns throughout the year, which assisted the average advisors’ revenue by 11%, but the highest-growth advisors saw an average revenue lift of 26%. So, why so much higher? While there were many possible explanations presented—the one that stood out was the use of model portfolios.
Only 56% of the average advisors were found to use models, while a whopping 78% in the highest-growth segment deployed models.
This begs the question, even when showing the possible revenue growth, why don’t more advisors use model portfolios? The reason is simple – it is difficult to transition a book of business into model portfolios and takes effort to keep clients on model.
Doing the proper due diligence on potential investments is initially extremely time-consuming. For a Canadian portfolio manager, there are endless options: in fact, there are more mutual funds than stocks. In Canada, there are currently 3,350 stocks, 5,700 funds, and 1,250 ETFs. Determining, your asset allocation outlook is first and then you are faced with narrowing down the thousands of investment choices to the most appropriate for building a portfolio.
Once your model portfolio is built, a new obstacle arises: deploying the portfolio to client accounts. Due to each client’s situation, this part of the process is particularly onerous. Whether it is due to their capital gains (or loss) situation, legacy positions or costs associated with trading, it is a long process moving a practice onto a more modelled system. And there is no finish line, as there will always be unique situations.
It is kind of like golf, you will never become perfect but if you don’t put in the work, you won’t be good.
When implementing the portfolio, our suggestion would be to not let capital gains or cost influence your decision-making. The long-term benefits of clients being on a specific model portfolio outweigh the short-term negatives. If you have not yet taken the leap into this form of discretionary asset management, here are a few benefits that model portfolios can bring to create a more pleasant experience for your prospects & clients.
- Diversification
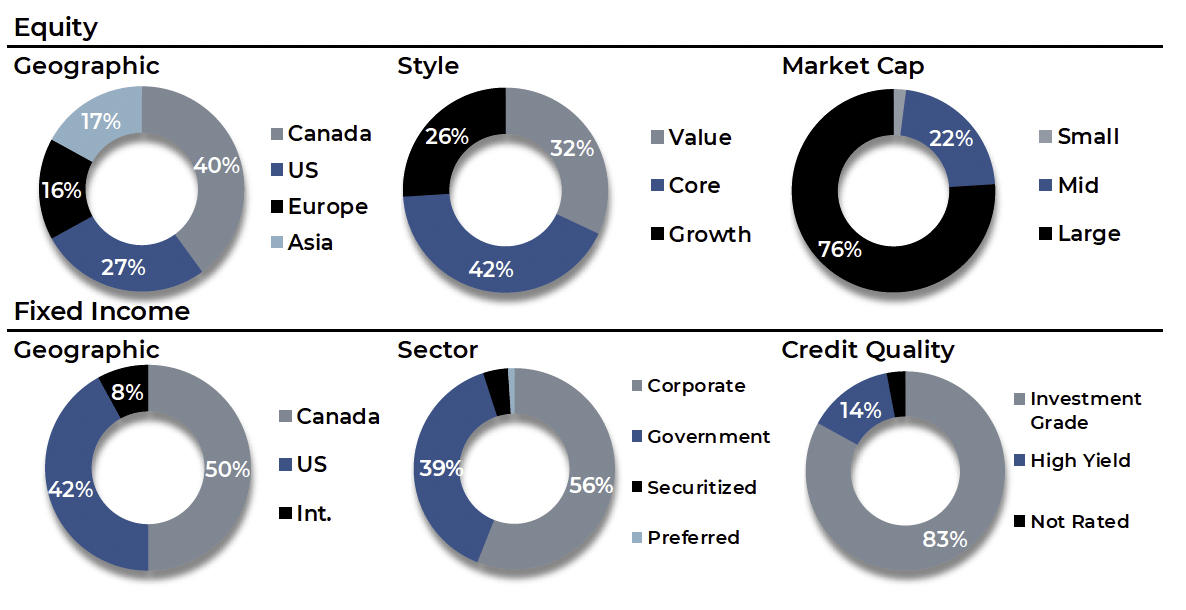
– Through the portfolio construction process you can truly diversify your clients amongst geographic regions, sectors, style, size, and fixed-income characteristics.
- Time-Saving
– Reducing the administrative burden of your practice allows for more time to be spent on marketing, growth, and servicing clients.
- Navigating Markets with Greater Efficiency – When it’s time to make a portfolio change, it is done across clients simultaneously. Often in practices not using models, changes are made at client review sessions or interactions. How absurd, timing a portfolio change based on a randomly timed meeting.
- Client Retention – Investment returns are important, but clients get value from a sense of security, peace of mind, financial planning, and achieving their goals. Spending more time communicating and servicing your clients builds long-lasting relationships.
- Goal Driven
– If a client is unhappy with the returns of a portfolio, it might mean they are willing to take more risk, which due to your model portfolios, simply means moving them up one model on the risk-return spectrum.
- Consistent Performance Track Record – As the years build up of operating a successful model portfolio framework, marketing content improves through the ability to show historical risk and returns of your portfolio.
All these benefits can improve your business, but they all have one thing in common: they allow you to bring scalability to your investment practice. This, in turn, should increase your overall revenue as seen in the prior chart. We hope that this convinces more advisors to start thinking about model portfolios, but we know not everyone will. However, more consistency across our industry will bring a long-awaited reputation boost. If the benefits above have not provided enough motivation to consider the switch, check out the results below from a Broadridge report where advisors were asked about their use of model portfolios.
If the above has piqued your interest, it is best to break down the process into steps. The first step would be to gain insight into your current investment situation. There are several portfolio lens solutions available to advisors. Nailing down where you currently sit and where you want to go is a great starting point for the process.
We have a service at Purpose available to advisors that allows us to do a deep dive into your current situation and recommend where we would place the initial importance in a transition.
Feel free to reach out to us if you are interested in gaining insight into your current investments. Our lens dives deep into every investment to understand all facets of your overall landscape, allowing us to assist you to make decisions based on the underlying attributes that you otherwise may not have access to.
Incorporating model portfolios comes with the prospect of articulating the benefits to your clients. Perhaps up until now, you have focused on providing “customized solutions” for clients. Let’s say with 100 clients, nine of ten strategies are consistent, but each client has one custom strategy—that now has your team monitoring/managing 109 investments. If they all had the same 10 investments, with varying weights based on risk and return objectives, you could really know and monitor those 10.
Client benefits of moving onto model
- More thoughtful and thorough insights into asset allocation and portfolio exposures/tilts
- Improved investment process given greater resources devoted to manager due diligence and monitoring
- Better communications on markets and portfolio changes which can be streamlined
- Frees up more time for planning and client service
One of the greatest aspects of the financial advice business is the diversity of paths. There is no perfect solution, there is no “optimal” portfolio, there is no just right model, there is no ideal way to run a practice. Provide a valuable service to your clients, help them avoid mistakes, and achieve their long-term financial goals.
That is it. We just believe that using a more disciplined model approach, while challenging to initiate, has so many long-term benefits for your clients and your practice. It’s worth putting in the work.
— Craig Basinger is the Chief Market Strategist at Purpose Investments
— Greg Taylor is the Chief Investment Officer at Purpose Investments
— Brett Gustafson is a Portfolio Analyst at Purpose Investments
— Derek Benedet is a Portfolio Manager at Purpose Investments
Source: Charts are sourced to Bloomberg L.P. and Purpose Investments Inc.
The contents of this publication were researched, written and produced by Purpose Investments Inc. and are used by Echelon Wealth Partners Inc. for information purposes only.
This report is authored by Craig Basinger, Chief Market Strategist Purpose Investments Inc.
Disclaimers
Echelon Wealth Partners Inc.
The opinions expressed in this report are the opinions of the author and readers should not assume they reflect the opinions or recommendations of Echelon Wealth Partners Inc. or its affiliates. Assumptions, opinions and estimates constitute the author's judgment as of the date of this material and are subject to change without notice. We do not warrant the completeness or accuracy of this material, and it should not be relied upon as such. Before acting on any recommendation, you should consider whether it is suitable for your particular circumstances and, if necessary, seek professional advice. Past performance is not indicative of future results. The comments contained herein are general in nature and are not intended to be, nor should be construed to be, legal or tax advice to any particular individual. Accordingly, individuals should consult their own legal or tax advisors for advice with respect to the tax consequences to them.
Purpose Investments Inc.
Purpose Investments Inc. is a registered securities entity. Commissions, trailing commissions, management fees and expenses all may be associated with investment funds. Please read the prospectus before investing. If the securities are purchased or sold on a stock exchange, you may pay more or receive less than the current net asset value. Investment funds are not guaranteed, their values change frequently and past performance may not be repeated.
Forward Looking Statements
Forward-looking statements are based on current expectations, estimates, forecasts and projections based on beliefs and assumptions made by author. These statements involve risks and uncertainties and are not guarantees of future performance or results and no assurance can be given that these estimates and expectations will prove to have been correct, and actual outcomes and results may differ materially from what is expressed, implied or projected in such forward-looking statements. Assumptions, opinions and estimates constitute the author’s judgment as of the date of this material and are subject to change without notice. Neither Purpose Investments nor Echelon Partners warrant the completeness or accuracy of this material, and it should not be relied upon as such. Before acting on any recommendation, you should consider whether it is suitable for your particular circumstances and, if necessary, seek professional advice. Past performance is not indicative of future results. These estimates and expectations involve risks and uncertainties and are not guarantees of future performance or results and no assurance can be given that these estimates and expectations will prove to have been correct, and actual outcomes and results may differ materially from what is expressed, implied or projected in such forward-looking statements. Unless required by applicable law, it is not undertaken, and specifically disclaimed, that there is any intention or obligation to update or revise the forward-looking statements, whether as a result of new information, future events or otherwise. Before acting on any recommendation, you should consider whether it is suitable for your particular circumstances and, if necessary, seek professional
advice.
The particulars contained herein were obtained from sources which we believe are reliable, but are not guaranteed by us and may be incomplete. This is not an official publication or research report of either Echelon Partners or Purpose Investments, and this is not to be used as a solicitation in any jurisdiction.
This document is not for public distribution, is for informational purposes only, and is not being delivered to you in the context of an offering of any securities, nor is it a recommendation or solicitation to buy, hold or sell any security.