Big week next week, with the US inflation number released on Tuesday.
Expectations are for YoY CPI to continue to drift lower, falling from 7.7% in October to 7.3% in November. This fall is already priced in, and as we'll get to later in this Ethos, there will be more to come. It's the deviations from the expected that catch the market off guard and can ignite a larger market move. Case in point: the 17% rally off the October lows from a rather meager 0.2% positive surprise. Markets have already started getting a case of the jitters, with the S&P 500 posting five straight negative days. The substantial rally has brought some holiday season cheer but appears to be petering out ahead of CPI and the next FOMC meeting.
Inflation
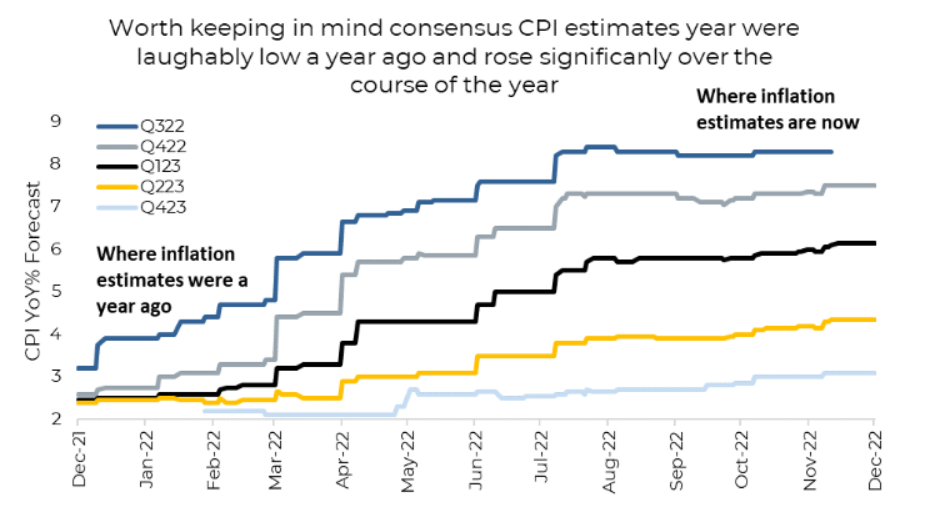
With all eyes squarely on CPI, we wanted to look at just what the market is expecting in the year to come. It's not a very bold call to say that it will decline – the US CPI already peaked in June at 9.1% and has now fallen for four months now. The pace and magnitude of the decline are two of the biggest factors for markets next year. Below we have a chart outlining the 'expected' path of US CPI. It paints a nice picture of it gliding lower. As the year progresses, you can see the dispersion building from the estimates of Canada's major banks. Data is from Bloomberg, and we've also plotted the weighted average of estimates from 48 firms. By the end of next year, headline CPI is currently expected to be 3.1%. Problem solved, right?
The contents of this publication were researched, written and produced by Purpose Investments Inc. and are used herein under a non- exclusive license by Echelon Wealth Partners Inc. (“Echelon”) for information purposes only. The statements and statistics contained herein are based on material believed to be reliable but there is no guarantee they are accurate or complete. Particular investments or trading strategies should be evaluated relative to each individual's objectives in consultation with their Echelon representative.
Reliability is a theme we'll touch on a few times in this Ethos, and as a test, we wanted to look at what the market expected of inflation a year ago. Transitory was still a keyword in Fed speeches, and Q4 2022 CPI estimates were a rather benign 2.6%. Over the course of the year, the expectations continued to ratchet higher, reaching a plateau of sorts by mid-year. This brings us back to something we discussed a number of Ethe ago – Forecasters' Folly. Truth is, even the best and brightest don't know. As a reminder, bank economists are paid to make predictions, not be right about them. These estimates didn't take into account the war in Ukraine and the ensuant rally in global commodity prices. How could they? Surprise events happen, markets react, and we adjust to that data. Simple as that.
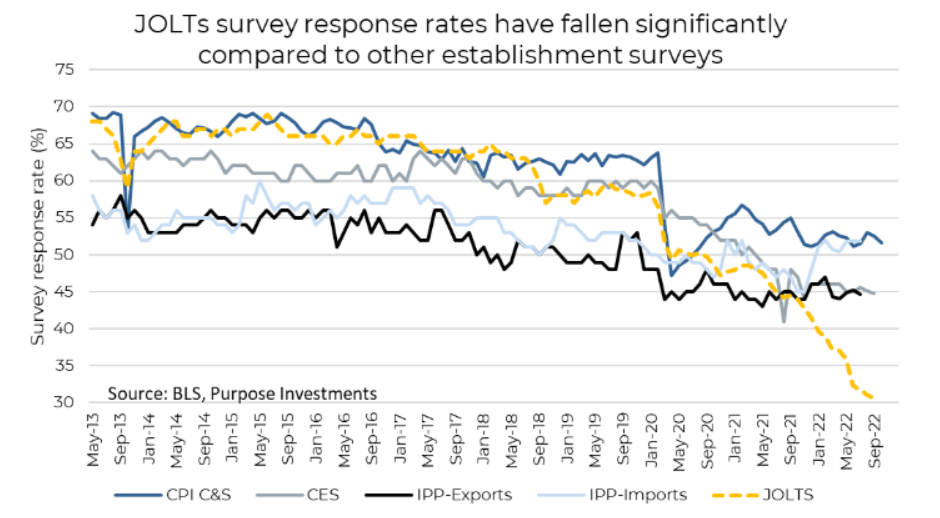
Data is important, especially with the lack of any real forward guidance for Fed policy. They continue to stress their data dependence, and rightfully so. However, a lot of the key data is not infallible, and there are some reasons to doubt the credibility of this data. Most importantly, there has been a dramatic falling off of response rates on a number of important economic surveys. The response rates for CPI, NFP, and JOLTs data have absolutely collapsed. CPI is down to 51%, NFP is down to 44.8%, and the JOLTs response rate is down to 31%, as shown in the chart below.
The JOLTs data is interesting. Job openings have increased over the past year and are now starting to fall, but we've seen far fewer responses. One potential implication is that the surveys may be potentially overstating how tight the market actually is. Taking this data at face value, with such a low response rate, is a risk. It could mean there's more volatility ahead as the market sorts through the true validity of the numbers. The JOLTs labour survey polls 21,000 companies, and with a response rate of 30.6%, just 6,000 companies are helping drive policy decisions for the world's largest economy. Commodity prices have already rolled over a decent amount, but labour market tightness and wage pressure will be key factors determining just how far and fast inflation rolls over in 2023.
True employment numbers are quite lagging; surveys help gauge the current job market but raise the risk of reliability, especially with such a low response rate. We're beginning to see job openings decline, which is a good sign since it could signal a slowing of inflationary wage pressures. The big question is why response rates are collapsing – there's no easy answer to that. Response rates measure the proportion of completed surveys to those issued; its sole role in being published is to assist the data user in judging the accuracy of the underlying data. Lower response rates could result in increased data volatility which is troubling. While still a large number, the falling response rates likely decrease the reliability of these results and reinforce the importance of more concrete data.
Surveys about confidence and expectations may be among the most meaningless data in today's economics. We pay attention to them in the hope they can reveal some upcoming or unique turning point. Timing any eventual turn based on a divergence is very tricky. Survey data fills in the gap that historical data cannot provide at a point in time which is why there is such interest in surveys in assessing current conditions. Part of knowing whether the data is unshakable or not is knowing how the data was gathered. In the case of many of these surveys, that seems to be more important than ever. Gauging the correct signal on the jobs market and inflation for next year is very important for investors, but it's more of an art than a science. While surveys might not be perfect, they are timely and carry considerable weight for the market. Still, we should be aware of their imperfections and, when possible, let the hard data tell the story as much as possible.
— Derek Benedet is a Portfolio Manager at Purpose Investments
Source: Charts are sourced to Bloomberg L.P. and Purpose Investments Inc.
The contents of this publication were researched, written and produced by Purpose Investments Inc. and are used by Echelon Wealth Partners Inc. for information purposes only. This report is authored by Craig Basinger, Chief Market Strategist, Purpose Investments Inc.
Disclaimers
Echelon Wealth Partners Inc.
The opinions expressed in this report are the opinions of the author and readers should not assume they reflect the opinions or recommendations of Echelon Wealth Partners Inc. or its affiliates. Assumptions, opinions and estimates constitute the author's judgment as of the date of this material and are subject to change without notice. We do not warrant the completeness or accuracy of this material, and it should not be relied upon as such. Before acting on any recommendation, you should consider whether it is suitable for your particular circumstances and, if necessary, seek professional advice. Past performance is not indicative of future results. The comments contained herein are general in nature and are not intended to be, nor should be construed to be, legal or tax advice to any particular individual. Accordingly, individuals should consult their own legal or tax advisors for advice with respect to the tax consequences to them.
Purpose Investments Inc.
Purpose Investments Inc. is a registered securities entity. Commissions, trailing commissions, management fees and expenses all may be associated with investment funds. Please read the prospectus before investing. If the securities are purchased or sold on a stock exchange, you may pay more or receive less than the current net asset value. Investment funds are not guaranteed, their values change frequently and past performance may not be repeated.
Forward Looking Statements
Forward-looking statements are based on current expectations, estimates, forecasts and projections based on beliefs and assumptions made by author. These statements involve risks and uncertainties and are not guarantees of future performance or results and no assurance can be given that these estimates and expectations will prove to have been correct, and actual outcomes and results may differ materially from what is expressed, implied or projected in such forward-looking statements. Assumptions, opinions and estimates constitute the author’s judgment as of the date of this material and are subject to change without notice. Neither Purpose Investments nor Echelon Partners warrant the completeness or accuracy of this material, and it should not be relied upon as such. Before acting on any recommendation, you should consider whether it is suitable for your particular circumstances and, if necessary, seek professional advice. Past performance is not indicative of future results. These estimates and expectations involve risks and uncertainties and are not guarantees of future performance or results and no assurance can be given that these estimates and expectations will prove to have been correct, and actual outcomes and results may differ materially from what is expressed, implied or projected in such forward-looking statements. Unless required by applicable law, it is not undertaken, and specifically disclaimed, that there is any intention or obligation to update or revise the forward-looking statements, whether as a result of new information, future events or otherwise. Before acting on any recommendation, you should consider whether it is suitable for your particular circumstances and, if necessary, seek professional
advice.
The particulars contained herein were obtained from sources which we believe are reliable, but are not guaranteed by us and may be incomplete. This is not an official publication or research report of either Echelon Partners or Purpose Investments, and this is not to be used as a solicitation in any jurisdiction.
This document is not for public distribution, is for informational purposes only, and is not being delivered to you in the context of an offering of any securities, nor is it a recommendation or solicitation to buy, hold or sell any security.