Commodity Supercycle Unlikely

The Echelon Insights Team • Jun 07, 2021

Market Recap – Just Keep Swimming


  • GO CANADA GO –Alright, any hopes for Toronto Maple Leaf fans to cheer that in the Stanley Cup finals are gone. But hey, nothing says getting back to normal like a Leafs’ first round exit from the playoffs, so maybe the “New Normal” will be more normal than most think. Turning to Canadian equities, we do have something to cheer about. Canada is one of the top-performing indices year to date (+13.2%), bolstered by a strong showing in May which saw the TSX rise +3.3%, more than the US, Europe and Asia. The market isona tear with our first dose vaccine comeback a strong driver (Chart 1). We now rank in 2nd place only behind Israel, which we will likely catch in the coming days. Even with the USA and UK blowing their 4th quarter lead in first doses, they are still very much ahead of us in the second dose race. 


  • Keeping the same narrative, the CAD continued to strengthen vs. the USD in May. Starting off the month at 81.4, the Canadian spot rate closed at 82.9 driven by commodities. A robust month for commodities saw gold finish the month at US$1,903/oz(+7.6%), reaching a key technical barrier that had not been seen since back in early January. WTI crude rose +4.3%, continuing to push higher amidst improving demand & supply uncertainty, capping off the month at US$66.32/bbl. 


  • Despite the above storylines, not everything was positive this month, especially in Canadian dollar terms. The S&P 500 posteda +0.5% month in USD, but converting that number into Canadian dollars presented a -1.1% month, negatively affecting Canadians invested in the United States. Looking elsewhere, the Euro Stoxx 50 rose +1.5% (CAD), while emerging markets witnessed a rise of +0.7% in Canadian dollars. Of course, a decent month internationally does not tell the whole picture. Year to date, many indexes are posting double-digit gains as the markets continue to price in a rosy outlook. 


  • Before the jump in inflation data last month, the narrative was concerned with rising yields and no sign of inflation. Headlines have now flipped to ‘we have rising inflation but yield has stalled’. Those rising yields in previous months were foretelling the coming inflation data, which saw US CPI jump from +2.6% to +4.2%. Most headlines state the rise will be ‘transitory’ but lack a clear definition of the widely used term. The big question remaining is, if we get a month or two more of elevated inflation, will the bond market begin to react? 


  • Volatility is nothing new to Cryptocurrency, but investors did have to withstand a significant decline this month. Specifically looking at Bitcoin, we saw a drop of -38% to US$35,218 (Chart 2), the largest drop since November 2018. Off the highs of ~$63,000, that loss stings, even if you are prepared for it. The main culprits for the pullback reside with China banning financial institutions from providing any cryptocurrency related transactions, India proposing a bill that would criminalize activity in crypto, Elon Musk flip flopping and Fed chair Jerome Powell stating crypto poses risks to financial stability, indicating stronger future regulation. 


  • There has been a lot of talk recently about whether or not we are seeing a commodity supercycle. With commodities rising to extreme levels, this question has become valid. As investors, we must take a step back to evaluate whether the rise will be prolonged or short lived. 

Asset Allocation – Market Cycle & Portfolio Positioning

  • Say what you will about the equity markets, some of which appear overvalued and are pricing in a lot of good news (mainly theU.S. equity market). You could even say there are some small bubbles out there. But one thing is for certain: the economic outlook for 2021 is looking pretty good and has a lot of momentum.


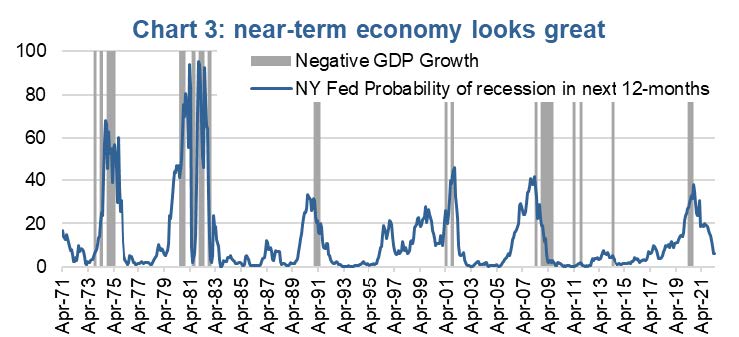
  • The global COVID-19 case counts are coming down, unprecedented stimulus remains largely in place, economies are re-opening, and there is pent-up demand by citizens to spend some of those savings –all good for the economy. With this kind of momentum, even with some softening of late, has the probability of a recession in the next 12-months down to 5%. For comparison, this gauge from the NY Federal Reserve was rising at an accelerating pace during 2019 into early 2020 –an accurate alarm bell for the last recession. Typically, 5% is the lower bound for this index, implying a very low likelihood of a recession anytime soon. (Chart 3).


  • Even if we do see a pullback in equities, which we would argue is overdue, this would be a buying opportunity given the low probably of a recession. Historically, pretty much any material drawdown in the equity market is a buying opportunity as long as it isn’t coinciding with a recession. Unfortunately, we don’t know a recession has started until months after the fact, but safe to say there isn’t one in the works today. 


  • Supporting this ‘low recession probability reading’ is our Market Cycle indicators. We did see a slight dip from last month, 30 to 29 bullish, but this is still very high and elevated (Chart 4).The vast majority of economic indicators remain bullish of a continuation of the market cycle. The only negatives remaining are valuations in the equity market, emerging market momentum and energy demand.  


  • Our portfolio recommended positioning has not changed over the past month. We remain market equity to a tiny overweight in equities, underweight in bonds and overweight in cash. The cash balance is earmarked as opportunistic capital if / when the market corrective phase hits. (Chart 5).


  • Within equities we have a market weight in both Canada and the U.S. with an overweight International. We are more cautious for the U.S. market and have this capital tilted towards value / dividend payers and less exposed to the megacaptech. International markets, and Canada, are not cheap by historical standards but are still not overly expensive. Relative to the U.S. market, international is cheap on a relative basis, providing a buffer on a pullback and upside potential should this historically high spread narrow. 


  • We remain constructive on the market cycle looking out a year+. However, given the advance we have seen this year, we would encourage some profit-taking to raise cash for the potential pullback, as well as taking advantage of the highly valued Canadian dollar to do some non-Canadian buying. 

Fixed Income – GICs, a better alternative to short-term bonds today


  • Although the past few months have been characterized by rising long-term yields, short-term yields continued to be anchored close to zero by central bank policy.


  • Credit spreads also remain narrow, resulting in low yields on short-term corporate bonds –the weighted average yield to maturity on the underlying holdings iShares Core Canadian Short Term Corporate Bond Index ETF is currently just 1.22%.


  • Guaranteed Investment Certificates (GICs) have many similarities to corporate bonds. They are deposits that represent a term loan to the financial institution, with a guaranteed rate of return. 


  • The benefit of a GIC over a corporate bond is Canadian Deposit Insurance Corporation (CDIC) insurance –CDIC is a federal crown corporation and effectively this provides a 100% federal guarantee on the investment.


  • Optically, always priced at par in accounts, they also convey a sense of safety.


  • Historically, GIC rates have been lower than yields on corporate bonds in wholesale markets. This has resulted in superior long-term returns from corporate bonds, mutual funds, and ETFs.


  • Today however, yields on GICs are superior to what we see in wholesale markets. By comparison, a 5-year fully CDIC insured GIC ladder today provides a greater rate of return than an A/BBB rated corporate bond ladder would.


  • This is also notable for investors looking to park cash –cashable GICs and high-interest savings account rates are much higher than that on Bankers Acceptances and wholesale term deposits.


  • Although we don’t look for this to be a permanent change in the investment landscape, investors who are underweight fixed income and duration in expectation of higher yields ahead should note and take advantage of this current phenomenon.

A not so ‘super’ cycle


  • Broadly speaking, all commodities have overcome pre-pandemic levels by a large degree. Chart 7 defines various commodity types, and the respective period returns over the past year. It’s no wonder that inflation concerns are creeping into the market narrative given this much price appreciation. 


  • With some commodities at, or near, all-time highs, we’re not surprised with the growing chatter of a commodity supercycle. Supercyclesare rare and long lasting, and historically share a few common characteristics. Supercycles require a sizable and sustained rally in commodity prices from a fundamental shift in demand overtaking supply that is too slow to respond. Going back the past 130 years, there have been about 4 supercyclesas detailed in Chart 8. 


  • The upswing phase in supercycles results from a lag between unexpected, persistent and positive shocks to commodity demand in conjunction with a slow-moving supply response. Current demand is being driven by the cyclical recovery of the economy following the vaccine rollout, increased infrastructure spending in many countries as well as shifts in environmental policy.Importantly, the deceleration in China’s “old economy” will also prove to be a strong counterforce to offset the acceleration in industrial production in developed economies. The sustainability of the current demand upswing is also in question, given an expected shift in consumer demand for services rather than ‘hard’ goods. Economic re-opening does not equal a multi-year sustained increase in commodity demand, a prerequisite for a commodity supercycle.


  • Many of the most dramatic commodity prices increases are due to a combination of both higher-than-expected demand and supply issues. A prime example is the oil embargo in the 1970s. The current logistical mishaps, whether they be too few sawmills, shipping constraints or boats getting stuck in a canal, appear rather transient. Time will cure them, bottlenecks just slowed things down a bit. Inventories for many commodities remain healthy, with plenty of product available.


  • Past commodity cycles have also benefited from a depreciation of the U.S. dollar. Is this a prerequisite? Not necessarily, but it certainly helps. For the cycle to continue in a meaningful way, you likely need the U.S. dollar to continue to lose value. This also drives inflation risks and together with it rising bond yields, which beget a potential shift in monetary policy that could quickly derail the commodity comeback. 


  • The story for each commodity is rather nuanced and idiosyncratic. Copper is one example of a metal that could be a more durable bull market, but the rationale behind the popularity of Dr. Copper has nothing to do with lumber prices or the price of tea in China. No doubt it’s been a good time for commodity exposure and a healthy home country bias, but we’d question characterizing it as a supercycle to endure for years to come. The critical aspect is that the demand surprise may not be as enduring as some expect and we expect the supply issues to resolve over the course of the year. We still like commodity exposure given the potent structural backdrop for real assets, but more in a tactical sense. 

Is the transition to a green economy finally here? 

  • Climate change is not a new problem; for decades environmental enthusiasts have been highlighting the problems caused by our lust for burning fossil fuels. Rising temperatures, melting icebergs and increased catastrophic natural disaster brought scientific proof to the problem, as combating climate change gradually becomes a defining struggle of this century.


  • With the Biden administration recommitting to the Paris Agreement, and a flood of pandemic-induced fiscal stimulus around the globe geared toward green technology and infrastructure, it appears the secular shift to a green economy is accelerating. 


  • Transitioning from hydrocarbon-based energy to renewable sources is not as easy as just flipping a switch. 


  • The install base of current infrastructure has taken place over many decades. Currently wind and solar have only 10-30% the density of power compared to a barrel of oil. Redistributing assets to renewable sources will reduce overall productivity and GDP growth, putting policy makers in a precarious position of balancing prosperity with the wellbeing of the planet.


  • With the current state of technology you can’t have both high GDP growth and a fast transition to renewable energy. Neglecting to invest in hydrocarbons will also increase the frequency of issues. We saw this in Texas earlier this year when winter storms caused power outages at wind and solar power infrastructure, resulting in a grid blackout. 


  • To achieve Paris climate goals and the path to net zero emissions, electrification and renewable energy will be key.


  • Battery technology and the commodities that support it, such as lithium, nickel, manganese and cobalt, will be critical to energy transition.


  • Copper is the most cost-effective conductive metal used in capturing, storing and transporting electricity; making it likely one of the most strategically important resources in this transition.


  • The supply side has been completely unprepared for this green movement as there has been very little investment. This could lead to a supply crunch in the years to come as electrification ramps up over this decade. 


  • Even with record high copper prices, there have been no major copper projects approved over the past 18 months; It often takes four to five years for a new copper mine to move into production. 


  • Goldman Sachs estimates that green global demand for copper only accounts for 4% of demand but expect that to double over the next three years, accounting for 20% of overall demand by the end of the decade.


  • This provides a more supportive backdrop for commodities that are increasingly seeing demand growth from this green movement.(Chart 9).


  • We have seen huge rallies in both oil and coal caused by the aforementioned economic restart and lack of investment. 


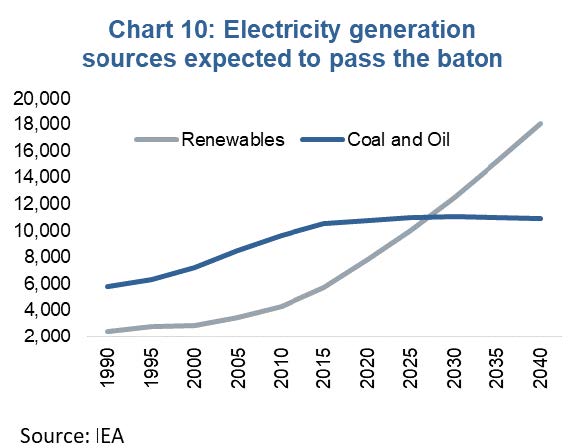
  • Oil is not going away any time soon but will face growing challenges while providing cyclical investment opportunities. However,clean energy and the commodities that support the build out seem to be at the start of a multi-decade cycle. (Chart 10).

Charts are sourced to Bloomberg L.P. unless otherwise noted.


The contents of this publication were researched, written and produced by Richardson Wealth Limited and are used herein under a non-exclusive license by Echelon Wealth Partners Inc. (“Echelon”) for information purposes only. The statements and statistics contained herein are based on material believed to be reliable but there is no guarantee they are accurate or complete. Particular investments or trading strategies should be evaluated relative to each individual's objectives in consultation with their Echelon representative. 


Forward Looking Statements


Forward-looking statements are based on current expectations, estimates, forecasts and projections based on beliefs and assumptions made by author. These statements involve risks and uncertainties and are not guarantees of future performance or results and no assurance can be given that these estimates and expectations will prove to have been correct, and actual outcomes and results may differ materially from what is expressed, implied or projected in such forward-looking statements.


The opinions expressed in this report are the opinions of the author and readers should not assume they reflect the opinions or recommendations of Echelon Wealth Partners Inc. or its affiliates. Assumptions, opinions and estimates constitute the author’s judgment as of the date of this material and are subject to change without notice. We do not warrant the completeness or accuracy of this material, and it should not be relied upon as such. Before acting on any recommendation, you should consider whether it is suitable for your particular circumstances and, if necessary, seek professional advice. Past performance is not indicative of future results. These estimates and expectations involve risks and uncertainties and are not guarantees of future performance or results and no assurance can be given that these estimates and expectations will prove to have been correct, and actual outcomes and results may differ materially from what is expressed, implied or projected in such forward-looking statements.


The particulars contained herein were obtained from sources which we believe are reliable, but are not guaranteed by us and may be incomplete. The information contained has not been approved by and are not those of Echelon Wealth Partners Inc. (“Echelon”), its subsidiaries, affiliates, or divisions including but not limited to Chevron Wealth Preservation Inc. This is not an official publication or research report of Echelon, the author is not an Echelon research analyst and this is not to be used as a solicitation in a jurisdiction where this Echelon representative is not registered.


The opinions expressed in this report are the opinions of its author, Richardson Wealth Limited (“Richardson”), used under a non-exclusive license and readers should not assume they reflect the opinions or recommendations of Echelon Wealth Partners Inc. (“Echelon”) or its affiliates.


This is not an official publication or research report of Echelon, the author is not an Echelon research analyst and this is not to be used as a solicitation in a jurisdiction where this Echelon representative is not registered. The information contained has not been approved by and are not those of Echelon, its subsidiaries, affiliates, or divisions including but not limited to Chevron Wealth Preservation Inc. The particulars contained herein were obtained from sources which we believe are reliable, but are not guaranteed by us and may be incomplete.


Assumptions, opinions and estimates constitute the author’s judgment as of the date of this material and are subject to change without notice. Echelon and Richardson do not warrant the completeness or accuracy of this material, and it should not be relied upon as such. Before acting on any recommendation, you should consider whether it is suitable for your particular circumstances and, if necessary, seek professional advice. Past performance is not indicative of future results. These estimates and expectations involve risks and uncertainties and are not guarantees of future performance or results and no assurance can be given that these estimates and expectations will prove to have been correct, and actual outcomes and results may differ materially from what is expressed, implied or projected in such forward-looking statements.

Forward-looking statements are based on current expectations, estimates, forecasts and projections based on beliefs and assumptions made by author. These statements involve risks and uncertainties and are not guarantees of future performance or results and no assurance can be given that these estimates and expectations will prove to have been correct, and actual outcomes and results may differ materially from what is expressed, implied or projected in such forward-looking statements. 

Echelon’s Insight Team


Echelon’s Insight Team includes members in various departments such as Wealth Management, Capital Markets, Marketing, Talent, and Compliance who have subject matter expertise and collaborate together to build quality content to help our clients. This team approach helps us ensure content is produced that is meaningful, accurate and timely.

06 May, 2024
Take your pick. There is no shortage of both good and bad news floating about the financial markets. To be fair, this is always the case. The hard part is understanding which side is stronger today and which side will be stronger tomorrow. With markets up low to mid-single digits following a very strong Q4 finish to 2023, most would agree the optimists are carrying the day at the moment. It is not just rose-coloured glasses; there is good news out there. Economic growth signs or momentum appear to be improving year-to-date. Dial back a few quarters, and the U.S. economy remained resilient while other economies softened or were rather lacklustre, including Canada, Europe, Japan, and China, to highlight some of the biggies. Today, while Canada is struggling, momentum in the U.S. has moved even higher, and there are signs of improvement in most jurisdictions.
29 Apr, 2024
There are three things you should rarely ever bet against: the Leaf’s opposing team in the playoffs, the American consumer’s ability to spend, and corporate profits. As we are now about halfway through U.S. earnings season, once again, positive surprises remain the norm; 81% have beaten. It's a bit better than the 20-year average of 75%. The fact is that companies are good at managing analysts’ expectations. At least enough to beat them when the numbers hit the tape. The size of the positive surprises have been encouraging as well, at just under 10%. The highest surprise magnitude in some time.  One of our reservations on the sustainability of this market rally over the past couple of quarters has been the flat earnings revisions. In other words, global markets are up over 20% but earnings estimates have remained flat or tilted down slightly. More often than not, markets trend in the same direction as earnings revisions. Earnings get revised up when companies raise guidance and/or analysts become more encouraged about growth prospects. That is a good thing for markets. Obviously, downward revisions are bad. Yet estimates have remained very flat as markets marched higher, a challenging combination.
22 Apr, 2024
The oil market has been interesting lately and, to the surprise of many, has been the biggest silent outperformer this year. There is no shortage of geopolitical events to choose from that’s leading to a higher risk premium in oil with Brent breaking $90, whether it’s the Houthis missile attacks in the Red Sea leading to a massive re-route of trade, Ukraine’s drone strikes on Russian refineries, and the latest escalation between Israel and Iran leading to some news outlets using WWIII as click bait-y headlines. Given the run-up in oil prices, Canadian oil equities have clearly benefitted from the much higher torque. But there is a layer of even better news: The Transmountain Expansion (TMX) continues to look to be in operation by May, which would lead to much better pricing on the Western Canadian Select (WCS). With the current setup for the oil markets, some key questions that we often get from investors are: How sustainable is the rally in Canadian energy names? To determine if the oil equities are overstretched, we can look at the debt-adjusted cash flow (DACF) multiples of the major integrated oil names and see how the valuation has shifted in light of the recent oil move. From Exhibit 1, the DACF multiples for the Canadian integrated have been fairly range-bound over the last year, also in line with WTI, which has been in the $70 - $85 range. As a starting point, we can infer that the valuations of the companies have been commensurate with the movements in the underlying oil price deck and in line with where the equities should trade in the cycle historically over the last couple of years. Typically, in the commodities cycle, higher prices are usually coupled with lower multiples as market participants will usually price in lower normalized prices and vice versa, so a cause of concern would be if valuation starts trending towards the 6.5x – 7.0x+ area if oil prices continue to stay in the upper bounds of the $70 - $90 range or higher.
MORE POSTS →
Share by: