Uncertainty is the bane of the markets and we have experienced a higher than normal dose over the past few years.
The greatest level of uncertainly was clearly during the early days of the pandemic when nobody knew anything about how things would unfold. As uncertainty declined, markets rose … quickly. The markets have clearly enjoyed 2021, with vaccine rollouts, re-opening trends and economic recovery driving earnings growth, plus continued monetary + fiscal stimulus. The S&P and TSX are up about 20% since January 1, with similar numbers out of Europe.
The balance of the year will likely prove more challenging. A few hurdles for the market include uncertainty on the future path of stimulus, the current feverish pace of economic growth normalizing and the path of inflationary pressures. Inflation will come down, but will we see margin erosion or wage pressures in the coming months? These hurdles are not insurmountable, but given valuations of 19x for global equities and 22x for the U.S., we could see some multiple contraction on any misstep.
Sharing return expectations for the market is a humbling exercise. The market tricks just about everyone sooner or later, which causes most to give up the exercise and simply rely on long-term averages. Just look at valuations: a year ago the S&P 500 was trading at 23x earnings which implies a muted forward return. Yet fast forward to today, and the S&P is up 31% including dividends. Certainly elevated valuation levels alone were not a useful input into returns for the past year.
So should we have concerns over the current valuations level? Yes, but it’s not just valuations anymore as the market, especially the U.S. market, has more and more cards stacked against it. Chart 1 contrasts not just valuations but expected forward earnings growth, yields, credit spreads and the CBOE Volatility Index (VIX) from August last year to today. Valuations remain elevated and slightly improved but haven’t moved much. Bond yields are a bit higher, which is comparatively positive. Stronger headwinds today compared to a year ago include lower earnings growth (still healthy but lower). Plus tighter credit spreads and an already lower VIX reflecting a very rosy world.
This doesn’t mean markets will go down but repeating the performance of the past year will be a more difficult, especially if uncertainty rises around monetary policy, margins, inflation or the pace of the economic recovery.
With the valuations of the S&P 500 over 20x, the average subsequent one-year price return for the S&P is low single digits (chart 2). Keeping in mind what happened last year, valuation shouldn’t be the only input, yet it still matters. Also worth noting: when the starting point is over 20x, the S&P 500 has only been higher 43% of the time in the subsequent year. Compare that to the average of all one-year periods regardless of valuations levels, and the market is up 80% of the time.
The TSX is in a similar situation. On the positive side, the TSX at 15.8x is just a hair over the threshold to be in the highest quartile of valuations over the past 30-years. But that most expensive quartile has a forward one-year average return of -0.3%.
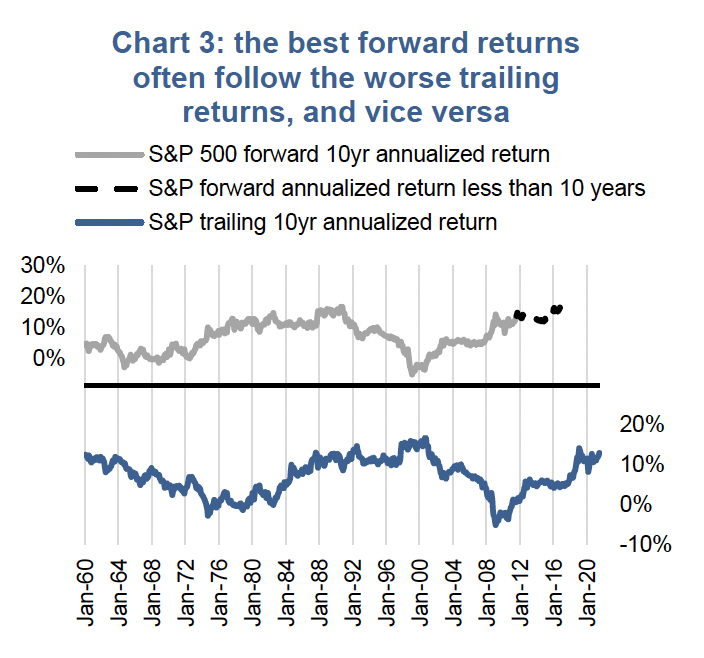
Even if you believe things will keep getting better with the re-opening/recovery supporting the current elevated valuations, slowing earnings growth, low credit spreads and VIX (a proxy for market fear), chart 3 is pretty compelling. The bottom panel shows the S&P 500 trailing 10-year annualized return, and the top panel is the forward 10-year annualized return. The dashed line is the forward annualized return but less than a 10-year period. Generally, better returns follow poor returns. Given we are near the upper historical threshold of trailing returns, this does not bode well for futures returns.
Keep in mind this is the S&P 500 or U.S. equities, and the trailing performance is not nearly as elevated in Canada or many international markets. Valuations are also not nearly as elevated outside the U.S. More and more reasons to increase your global equity exposure at the expense of a U.S. allocation.
Investment Implications
Don’t get us wrong, things continue to improve. The economic recovery is on, companies are making more money now than ever, yields are still lowish, retail investors are becoming more engaged and the stimulus continues to flow. Markets are at all-time highs and sell-offs seem to end after a few days. But you know how the saying goes, it is always brightest before sunset. Alright, maybe that isn’t the saying, but the meaning holds.
Most of the levers to move the market higher have been pulled. As contrarians, this means we are sharing our muted return expectations for the market. While not a dire outlook, repeating the strong double-digit returns will be a challenge.
Charts are sourced to Bloomberg L.P. unless otherwise noted.
The contents of this publication were researched, written and produced by Richardson Wealth Limited and are used herein under a non-exclusive license by Echelon Wealth Partners Inc. (“Echelon”) for information purposes only. The statements and statistics contained herein are based on material believed to be reliable but there is no guarantee they are accurate or complete. Particular investments or trading strategies should be evaluated relative to each individual's objectives in consultation with their Echelon representative.
Forward Looking Statements
Forward-looking statements are based on current expectations, estimates, forecasts and projections based on beliefs and assumptions made by author. These statements involve risks and uncertainties and are not guarantees of future performance or results and no assurance can be given that these estimates and expectations will prove to have been correct, and actual outcomes and results may differ materially from what is expressed, implied or projected in such forward-looking statements.
The opinions expressed in this report are the opinions of the author and readers should not assume they reflect the opinions or recommendations of Echelon Wealth Partners Inc. or its affiliates. Assumptions, opinions and estimates constitute the author’s judgment as of the date of this material and are subject to change without notice. We do not warrant the completeness or accuracy of this material, and it should not be relied upon as such. Before acting on any recommendation, you should consider whether it is suitable for your particular circumstances and, if necessary, seek professional advice. Past performance is not indicative of future results. These estimates and expectations involve risks and uncertainties and are not guarantees of future performance or results and no assurance can be given that these estimates and expectations will prove to have been correct, and actual outcomes and results may differ materially from what is expressed, implied or projected in such forward-looking statements.
The particulars contained herein were obtained from sources which we believe are reliable, but are not guaranteed by us and may be incomplete. The information contained has not been approved by and are not those of Echelon Wealth Partners Inc. (“Echelon”), its subsidiaries, affiliates, or divisions including but not limited to Chevron Wealth Preservation Inc. This is not an official publication or research report of Echelon, the author is not an Echelon research analyst and this is not to be used as a solicitation in a jurisdiction where this Echelon representative is not registered.
The opinions expressed in this report are the opinions of its author, Richardson Wealth Limited (“Richardson”), used under a non-exclusive license and readers should not assume they reflect the opinions or recommendations of Echelon Wealth Partners Inc. (“Echelon”) or its affiliates.
This is not an official publication or research report of Echelon, the author is not an Echelon research analyst and this is not to be used as a solicitation in a jurisdiction where this Echelon representative is not registered. The information contained has not been approved by and are not those of Echelon, its subsidiaries, affiliates, or divisions including but not limited to Chevron Wealth Preservation Inc. The particulars contained herein were obtained from sources which we believe are reliable, but are not guaranteed by us and may be incomplete.
Assumptions, opinions and estimates constitute the author’s judgment as of the date of this material and are subject to change without notice. Echelon and Richardson do not warrant the completeness or accuracy of this material, and it should not be relied upon as such. Before acting on any recommendation, you should consider whether it is suitable for your particular circumstances and, if necessary, seek professional advice. Past performance is not indicative of future results. These estimates and expectations involve risks and uncertainties and are not guarantees of future performance or results and no assurance can be given that these estimates and expectations will prove to have been correct, and actual outcomes and results may differ materially from what is expressed, implied or projected in such forward-looking statements.
Forward-looking statements are based on current expectations, estimates, forecasts and projections based on beliefs and assumptions made by author. These statements involve risks and uncertainties and are not guarantees of future performance or results and no assurance can be given that these estimates and expectations will prove to have been correct, and actual outcomes and results may differ materially from what is expressed, implied or projected in such forward-looking statements.