It was not that long ago, perhaps about a year at its peak frequency, that you couldn’t go far without coming across another report extolling the death of the plain vanilla 60/40 portfolio allocation. Time to rethink portfolio construction was the prevalent theme of the reports, often encouraging increased use of everything from commodities, market neutrals, CTAs, real assets, etc. The messaging resonated with investors, given their experiences of 2022 – a year in which that type of portfolio construction didn’t perform particularly well. But much like everything in the investment world, some strategies do better in some market environments and struggle in others.
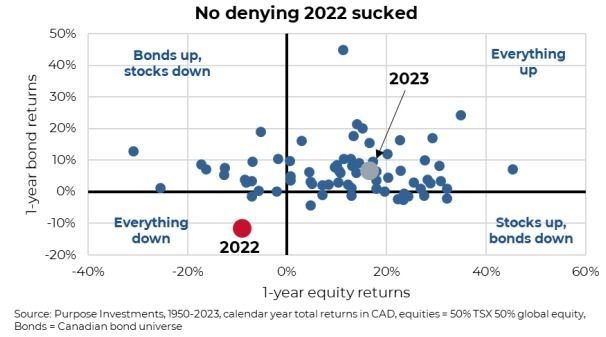
We are not downplaying just how much portfolio construction using plain vanilla inputs sucked in 2022. The chart below is based on 73 years of calendar year returns for bonds and equities. That is a long time that encompasses many recessions, inflationary environments, wars, etc. 2022 wasn’t the worst year on aggregate, but it was the worst year for both equities and bonds falling. Now, our equity proxy is a 50% TSX and 50% global equity; this would look a bit worse if you used less TSX, given our equity market held up better in 2022. However, 2023 did end up returning much back to normal right in the middle of the cluster.
Adding to the frustration of 2022, your risk profile was largely meaningless. Given that stocks and bonds fell in similar fashion, it was a unique year in which your weightings across asset classes didn’t really have much of an impact on performance. Growth investors holding more equity and fewer bonds are generally more comfortable with market volatility as they see it as an acceptable by-product of greater return expectations over time. Yet Conservative investors are more comfortable sacrificing return expectations in return for less oscillation in the market value of their portfolio.
This is kind of key to portfolio construction and it did not work in 2022. The chart below is based on proxies for a Conservative, Balanced and Growth investor allocations using plain vanilla index returns. As you can see, in 2022, they all travelled together, from the young growth investor to the conservative grandparent. In 2023, asset allocation once again mattered. Dare we say back to “normal?”
One of the attributes of good investors is knowledge. Don’t worry, it doesn’t need to be knowledge of market cycles, the economy, corporate financial statements, manager selection, or portfolio construction; that is more of a team’s full-time job and why the majority of investors use advice. Don’t rush out to sign up for the CFA just yet. But a base understanding of how markets work and how your portfolio is allocated goes a long way. Sometimes, returns are scarce, sometimes abundant. Sometimes a portfolio’s construction will struggle in certain market environments and often bounces back in the subsequent. The balanced proxy from above returned about 12% in 2023. Knowledge helps keep investors calm and, most importantly, helps them avoid making knee-jerk reactions to market oscillations. Such as abandoning portfolio construction after 2022 to load up on commodities and CTAs [Bloomberg commodity index fell 8% in 2023 after gaining 16% in 2022, Barclay Hedge US Managed Futures, proxy of CTA managers, was down 1% in 2023 (end of November) after gaining 15% in 2022]
Asset allocation works and is still the best tool for constructing portfolios for various risk/return objectives. Sure, it doesn’t work all the time as expected, but markets rarely go as expected. The average annual return for global equities is about 11% over the past 70+ years. That is a long-term average. Care to guess how many of those years are within +/- 5% of that average. Or in other words, how many years are within +6% and +17%? About 30%, which means 70% of the time, equity returns were below 6% or over 17%.
2022, and to a certain degree 2021, were unique because of how things were set up beforehand and some pretty big macro drivers. The cost and availability of credit were reset from low cost and abundant to higher cost and less abundant. The cause is actually rather irrelevant; it was this changing dynamic that caused various asset classes to move together. The good news is that may be over. There will be reverberations that continue but it is safe to say capital now demands a certain return that is higher than before, and there does appear to be less capital to be accessible.
Understanding that when the risk-free rate (using overnight central bank rates as a proxy) moves very quickly from a really low level to, let’s say, a normal or slightly high level, the price of all assets tends to adjust together. However, rates can only go from 0.25% to 5.5% once. Now that things have “reset,” it has become a healthier market. It won’t be a pleasant journey to get there, and we may not be all the way there just yet, but it is certainly a key part of the foundation for the next cycle.
We Like Alternatives, We Just Like Plain Vanilla Asset Allocation as Well
The increased access to different asset classes, strategies, and vehicles is a trend that continues and gives investors many more choices. That is a positive and significantly expands the building blocks for portfolio construction. Volatility management, defensive strategies, income enhancers, real assets, privates, the list goes on and continues to expand.
In fact, we are increasingly inclined towards real assets as our longer-term view is that inflation will become a recurring market issue in the years to come, not just a threat to markets but to your financial plan. Privates also continue to gain traction as accessibility to capital changes. Diversification has become harder to find in an ever-increasingly connected world. The chart below shows the correlation and beta (measuring degree of move) between Canadian stocks and bonds. Periods when stocks and bonds move together are not uncommon; in fact, it has been more common than not over the past 70 years. Some of those periods, like during the 1990s, were a great time to invest. However, the positive correlation/beta does mean the diversification benefits of a simple asset mix may be a bit less effective. Alternative sources of diversification could certainly help.
But not so fast. The availability of different strategies in the traditional long-only (non-alternative) universe have also expanded considerably over the years. Certainly on the lower-cost side via the rise of passive ETFs, but also with different strategies developed to gain different performance exposures. Momentum strategies can be designed to produce a very different experience. Bond strategies can range from ultra-long duration government bonds to syndicated bank loans.
And let's not forget, even if the diversification benefit between stocks and bonds is lower today than in the past decade or so, there is a silver lining. Bonds have a yield again, meaning they are not simply for diversification anymore and can have a more pronounced positive performance contribution to the portfolio. The yield-to-worse for the U.S. Aggregate Bond index is 4.7%... getting that kind of return from your bonds means that equities don’t have to do all the heavy lifting.
Final Thoughts
The positive of having more tools in the portfolio construction toolbox is that it offers greater flexibility in how to build portfolios. Alternatives certainly offer some very different investment experiences to address either opportunities or risk that goes beyond just expected returns and volatility. And the more plain vanilla long-only investment options now offer exposures at ultra-low cost to active strategies that can be very different than the overall market.
It may feel like choice overload, yet the good news is there are many different paths that lead to a successful investment journey. Traditional asset allocation will likely remain the core for most, yet there are many ways to enhance a portfolio, given ever-increasing options. Alternatives, combining both active and passive vehicles, and being more tactical with allocations all can help.
Equally important to portfolio construction is portfolio understanding. Understanding the true exposures and how they will likely behave in different market environments is critical in avoiding making knee-jerk reaction mistakes. Or more directly, don’t make it too complicated. Simple may not be sexy, but when investing, it tends to work much better.
— Craig Basinger is the Chief Market Strategist at Purpose Investments
Source: Charts are sourced to Bloomberg L.P. and Purpose Investments Inc.
The contents of this publication were researched, written and produced by Purpose Investments Inc. and are used by Echelon Wealth Partners Inc. for information purposes only.
This report is authored by Craig Basinger, Chief Market Strategist, Purpose Investments Inc.
Disclaimers
Echelon Wealth Partners Inc.
The opinions expressed in this report are the opinions of the author and readers should not assume they reflect the opinions or recommendations of Echelon Wealth Partners Inc. or its affiliates. Assumptions, opinions and estimates constitute the author's judgment as of the date of this material and are subject to change without notice. We do not warrant the completeness or accuracy of this material, and it should not be relied upon as such. Before acting on any recommendation, you should consider whether it is suitable for your particular circumstances and, if necessary, seek professional advice. Past performance is not indicative of future results. The comments contained herein are general in nature and are not intended to be, nor should be construed to be, legal or tax advice to any particular individual. Accordingly, individuals should consult their own legal or tax advisors for advice with respect to the tax consequences to them.
Purpose Investments Inc.
Purpose Investments Inc. is a registered securities entity. Commissions, trailing commissions, management fees and expenses all may be associated with investment funds. Please read the prospectus before investing. If the securities are purchased or sold on a stock exchange, you may pay more or receive less than the current net asset value. Investment funds are not guaranteed, their values change frequently and past performance may not be repeated.
Forward Looking Statements
Forward-looking statements are based on current expectations, estimates, forecasts and projections based on beliefs and assumptions made by author. These statements involve risks and uncertainties and are not guarantees of future performance or results and no assurance can be given that these estimates and expectations will prove to have been correct, and actual outcomes and results may differ materially from what is expressed, implied or projected in such forward-looking statements. Assumptions, opinions and estimates constitute the author’s judgment as of the date of this material and are subject to change without notice. Neither Purpose Investments nor Echelon Partners warrant the completeness or accuracy of this material, and it should not be relied upon as such. Before acting on any recommendation, you should consider whether it is suitable for your particular circumstances and, if necessary, seek professional advice. Past performance is not indicative of future results. These estimates and expectations involve risks and uncertainties and are not guarantees of future performance or results and no assurance can be given that these estimates and expectations will prove to have been correct, and actual outcomes and results may differ materially from what is expressed, implied or projected in such forward-looking statements. Unless required by applicable law, it is not undertaken, and specifically disclaimed, that there is any intention or obligation to update or revise the forward-looking statements, whether as a result of new information, future events or otherwise. Before acting on any recommendation, you should consider whether it is suitable for your particular circumstances and, if necessary, seek professional
advice.
The particulars contained herein were obtained from sources which we believe are reliable, but are not guaranteed by us and may be incomplete. This is not an official publication or research report of either Echelon Partners or Purpose Investments, and this is not to be used as a solicitation in any jurisdiction.
This document is not for public distribution, is for informational purposes only, and is not being delivered to you in the context of an offering of any securities, nor is it a recommendation or solicitation to buy, hold or sell any security.