For the 3rd time in as many years gold is brushing up against the 2,000/oz zone, which of course raises the question whether this resistance level will hold once again or will the yellow metal finally break out. As any investor that has invested in gold or gold miners for more than a few months, it can be one of the more frustrating and sometimes mystifying holdings. The rally in 2020 was pretty logical, given the uncertainty of covid and the amount of central bank balance sheet expansion. But the languishing price in 2021 and drop in the first half of 2022 was at odds given rising inflation. More recently, bank stress has seen gold rise again to 2,000 before giving a little back in recent weeks.
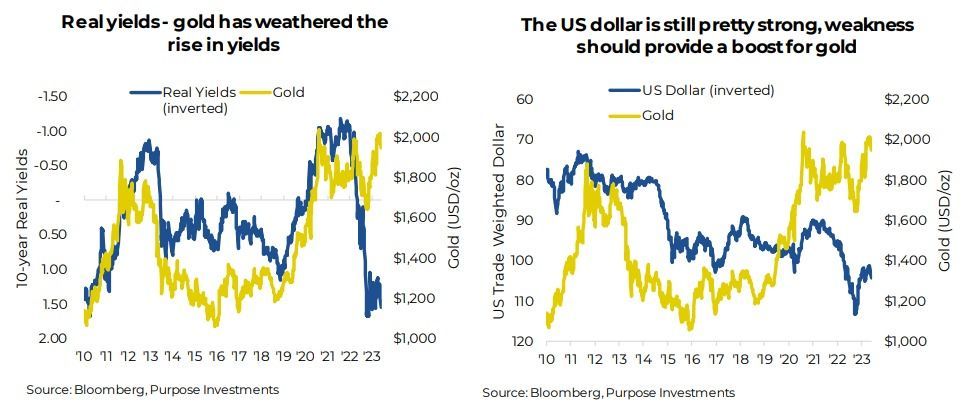
Even today, many historical drivers of gold prices are at odds. The rise in nominal and real bond yields certainly augers for a lower price of bullion. As does limited equity market volatility. Yet the persistent higher inflation is supportive of a higher price as is the U.S dollar. Nobody said investing would be easy.
Perhaps one of the biggest swing factors that tends to drive gold price is ETF flows, aka retail. As you can see in the chart, gold often moves in tandem with gold ETF flows. Both up and down over the years. Yet the recent advance has been during a period of ETF outflows. Counter the ETF outflows has been central bank buying, which set an all-time record in 2022 and continues into 2023. Perhaps the Western imposed sanctions has encouraged many central banks to increase their reserve diversification away from Treasuries on the margin. Whatever the motivation, this has helped counter the ETF flows.
Gold Technical Take
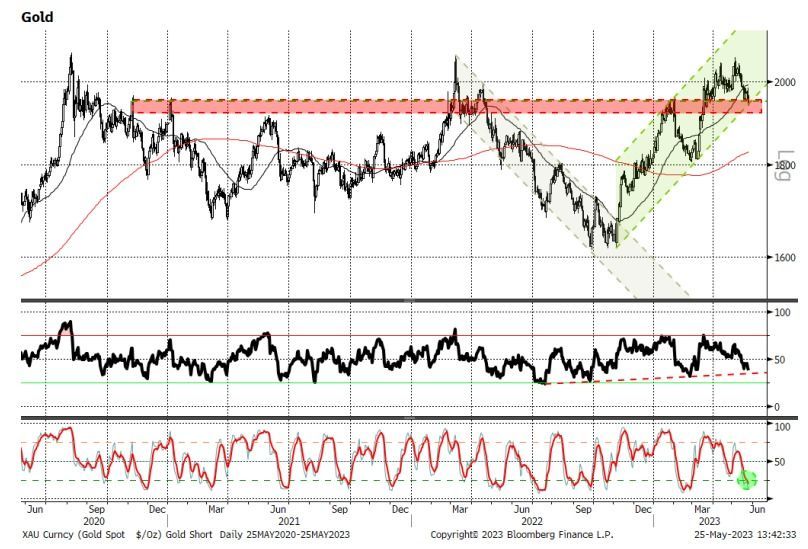
From a technical perspective, gold is at an interesting crossroad. Over the past three years, it’s gone from a new all time in 2020 to a prolonged consolidation period. It’s now attempted on two occasions to break through and solidly hold onto a 2000 handle. The first attempt early last year, saw it later retrench to nearly $1600/oz largely due to a strong dollar and central banks hiking rates at an accelerated pace. Following the breakout from that downtrend last November, gold has rallied alongside risk assets to attempt a second thrust to new highs. Aided by a mini bank crisis, gold held above $2000/oz for a number of days but has pulled back rather suddenly thanks in part to dollar strength, and rising rates. The pullback has brought it back to the lower bounds of the current trend channel.
With the price sitting on a key support level as well as staying within the current trend channel we see a favourable setup for a potential upside rotation back towards recent highs. For now, gold remains in a mid-long term upside trend with an upward bias.
As the bulls and bears battle it out around key support, it appears the gold market is mired with indecision. The RSI oscillator has pulled back below 50, but is showing a mild bullish divergence which is a good sign for the further rally. In addition, there is an impending bull cross on the MACD indicator. This indicates an oversold market with tiring sellers. Upside moves could find some resistance around the psychologically important 2000 level as well as the 50 day moving average at $1993. For those underweight, this is looking like a good time to begin to a build position from a risk/reward perspective.
What’s next?
Investing isn’t about trying to explain the past, its about the future. Do you think central banks will continue buying? We do. What about yields, both nominal and real? Well, gold has weathered yields moving higher in good fashion. They could still move higher but most of this move is probably done. And as the Fed likely stops raising rates soon, that should turn a headwind into no-wind. Inflation may continue to come down this year, as is our expectation, but will likely remain higher than past years. This should continue to be a positive for gold.
Then there is the dollar. We are not in the de-dollarization camp and the U.S. dollar could see an uptick if a recession develops. Near term that may be a headwind but if the dollar is moving higher on recession, market volatility may provide an offsetting tailwind. Sorry, too much talk of wind, starting to sound like some sort of swirling vortex. Nonetheless, longer term we are anticipating to be dollar bears, which is gold positive.
Final Thoughts
Gold remains a stone throw from a key resistance level despite cooling inflation and higher yields. If a recession is on the horizon, we believe yields could tick lower and market volatility rise. Both potential positives that could help gold finally break through this ceiling. And if retail start buying, which there has been some signs of late, this 3rd visit to resistance maybe the breakthrough gold investors have been long waiting for.
— Craig Basinger is the Chief Market Strategist at Purpose Investments
— Derek Benedet is a Portfolio Manager at Purpose Investments
Source: Charts are sourced to Bloomberg L.P. and Purpose Investments Inc.
The contents of this publication were researched, written and produced by Purpose Investments Inc. and are used by Echelon Wealth Partners Inc. for information purposes only.
This report is authored by Craig Basinger, Chief Market Strategist, Purpose Investments Inc.
Disclaimers
Echelon Wealth Partners Inc.
The opinions expressed in this report are the opinions of the author and readers should not assume they reflect the opinions or recommendations of Echelon Wealth Partners Inc. or its affiliates. Assumptions, opinions and estimates constitute the author's judgment as of the date of this material and are subject to change without notice. We do not warrant the completeness or accuracy of this material, and it should not be relied upon as such. Before acting on any recommendation, you should consider whether it is suitable for your particular circumstances and, if necessary, seek professional advice. Past performance is not indicative of future results. The comments contained herein are general in nature and are not intended to be, nor should be construed to be, legal or tax advice to any particular individual. Accordingly, individuals should consult their own legal or tax advisors for advice with respect to the tax consequences to them.
Purpose Investments Inc.
Purpose Investments Inc. is a registered securities entity. Commissions, trailing commissions, management fees and expenses all may be associated with investment funds. Please read the prospectus before investing. If the securities are purchased or sold on a stock exchange, you may pay more or receive less than the current net asset value. Investment funds are not guaranteed, their values change frequently and past performance may not be repeated.
Forward Looking Statements
Forward-looking statements are based on current expectations, estimates, forecasts and projections based on beliefs and assumptions made by author. These statements involve risks and uncertainties and are not guarantees of future performance or results and no assurance can be given that these estimates and expectations will prove to have been correct, and actual outcomes and results may differ materially from what is expressed, implied or projected in such forward-looking statements. Assumptions, opinions and estimates constitute the author’s judgment as of the date of this material and are subject to change without notice. Neither Purpose Investments nor Echelon Partners warrant the completeness or accuracy of this material, and it should not be relied upon as such. Before acting on any recommendation, you should consider whether it is suitable for your particular circumstances and, if necessary, seek professional advice. Past performance is not indicative of future results. These estimates and expectations involve risks and uncertainties and are not guarantees of future performance or results and no assurance can be given that these estimates and expectations will prove to have been correct, and actual outcomes and results may differ materially from what is expressed, implied or projected in such forward-looking statements. Unless required by applicable law, it is not undertaken, and specifically disclaimed, that there is any intention or obligation to update or revise the forward-looking statements, whether as a result of new information, future events or otherwise. Before acting on any recommendation, you should consider whether it is suitable for your particular circumstances and, if necessary, seek professional
advice.
The particulars contained herein were obtained from sources which we believe are reliable, but are not guaranteed by us and may be incomplete. This is not an official publication or research report of either Echelon Partners or Purpose Investments, and this is not to be used as a solicitation in any jurisdiction.
This document is not for public distribution, is for informational purposes only, and is not being delivered to you in the context of an offering of any securities, nor is it a recommendation or solicitation to buy, hold or sell any security.